Please refer to the Class 11 Economics Sample Paper for the current academic year given below. We have provided the latest CBSE Sample Papers for Term 1 and Term 2 for Economics Class 11. All guess sample papers have been prepared based on the latest blueprint and examination pattern for the current year. All sample papers for Economics Class 11 Term 1 and 2 have been given with solutions. Students can access the multiple guess papers given below. Practicing more Class 11 Economics Sample Papers will help you to get more marks in upcoming exams.
CBSE Sample Papers for Class 11 Economics
| Term 2 Sample Papers for Class 11 Economics |
| Class 11 Economics Sample Paper Term 2 Set A |
Class 11 Economics Sample Paper Term 2 Set A
Section – A
1. Explain ‘homogeneous products’ as a characteristic of a perfectly competitive market.
Answer : In a perfectly competitive market, buyers treat the product produced by different firms as homogeneous. So they are willing to pay the same price for products of different firms. No firm, therefore, can charge a price higher than the market determined price.
OR
Explain the implication of “Perfect Knowledge about Market” under perfect competition.
Answer : ‘Perfect Knowledge about Market’ means both buyers and sellers are fully informed about the market prices. Therefore, no firm is in a position to charge a different price and no buyer will pay a higher price. As a result, a uniform price prevails in the market.
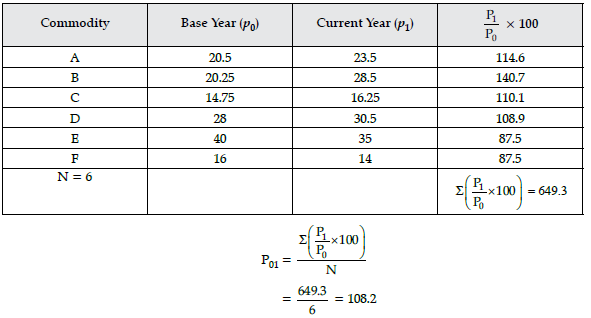
2. Construct the index number by Simple Average of Price Relative Method.
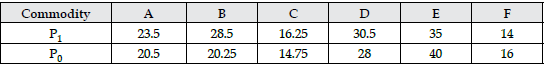
Answer : Construction of Index Number:
3. Discuss in brief, any one consequence of imposition of floor price.
Answer : (i) Surpluses: The quantity actually brought and supplied will shrink as a direct consequence of price flooring, as a result, a part of producer ’s stock will remain unsold.
(ii) Buffer Stock: In order to maintain the support price, the government may design some programmes to enable producers to dispose of their surplus stocks. One such programme can take the form of buffer stock. Government may purchase the surplus to store or sell it at subsidised prices. Subsidy is required to lower the price and make it competitive in the market. Government may also use it as aid and send it to other countries.
4. List any five characteristics of an ideal measure of dispersion.
Answer : An ideal measure of dispersion should possess the following characteristics:
(i) It should be simple to understand.
(ii) It should be easy to calculate.
(iii) It should be based on all the observations of the series.
(iv) It should be rigidly defined.
(v) It should be suited for further algebraic treatment.
OR
Which measure of dispersion is the best and how?
Answer : Standard deviation is considered to be the best measure of dispersion and is therefore, the most widely used measure of dispersion.
(i) It is based on all values and thus, provides information about the complete series. Because of this reason, a change in even one value affects the value of standard deviation.
(ii) It is independent of origin but not of scale.
5. Write short notes on the following:
(i) Negative Correlation.
(ii) Positive Correlation.
Answer : (i) Negative Correlation: Correlation is said to be negative or inverse, if the variables move in the opposite directions. For example, when the supply of a commodity increases, the price of commodity comes down.
(ii) Positive Correlation: When both the variables are moving in the same direction, correlation is said to be positive. For example, increase in the demand of a commodity tends to increase the price of commodities.
OR
What is scatter Diagram ? What are its demerits?
Answer : It is a technique to usually examine the relationship between variables in a visual manner. It is obtained by plotting the values of the variables on X-axis and Y-axis on graph paper.
Demerits:
(i) It does not exactly determine the correlation coefficient.
(ii) It cannot be interpreted by persons who do not understand the basic term like downward sloping and upward sloping, etc.
Section – B
6. What does a consumer price index for industrial workers measure?
Answer : A Consumer Price Index for Industrial Workers measures the impact of changes in the retail prices on the cost of living of industrial workers. In a country like India, CPI for industrial workers is estimated and published by the Labour Bureau, Shimla taking 1982 as the base year for the current series. In India, CPI for industrial workers is the most popular index and is used by the government to regulate Dearness Allowance (D.A.) to compensate its employees against the price rise. The weight schemes in CPI for Industrial Workers include food, pan, supari, tobacco, fuel and lighting, housing, clothing, and miscellaneous expenses. Food being the most important component has the highest weight. Thus, it implies that the food price changes have a significant impact on the CPI.
OR
Given the following data:
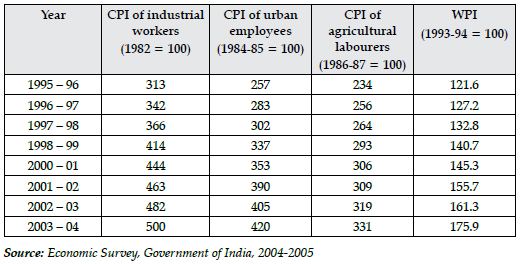
Comment on the relative values of the Index numbers. Are they comparable?
Answer : (i) (a) The values of CPI of industrial workers with base year 1982 are largest and the values of WPI are least for the whole period from 1993–96 to 2003–04.
(b) There were many ups and downs in the CPI of non-manual employees.
(c) There were many ups and downs in the CPI of agricultural labourers.
(ii) The index numbers are not comparable because of the following reasons:
(a) Base periods are different.
(b) Commodities for different index numbers may be different.
(c) The weightage given to different index numbers of different commodities may vary from one index number to another.
7. Calculate Karl Pearson’s coefficient of correlation from the following data:
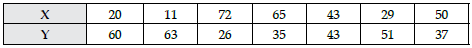
Answer :


Read the passage below and answer Q8. and Q9. that follows:
Monopsony refers to a market situation when there is a single buyer of a commodity or service. It applies to any situation in which there is a ‘monopoly’ element in buying.
For example, when consumers of a certain commodity are organised, or when a socialist government regulates imports, or when a certain individual happens to have a taste for some commodity which no one else requires, or when a single big factory in an isolated locality is the sole buyer of some grades of labour, there is monopsony.
Monopsony can be formally defined, in the words of Liebhafsky, as “the case of a single buyer who is not in competition with any other buyers for the output which he seeks to purchase, and as a situation in which entry into the market by other buyers is impossible”.
The analysis of monopsony pricing is similar to that under monopoly pricing. Just as a monopolist is able to influence the price of the product by the amount he offers for sale, similarly the monopsonist is able to influence the supply price of his purchases by the amount he buys.
8. How is monopsony different from monopoly?
Answer : Price discrimination happens when a firm charges a different price from different groups of consumers for an identical good or service, for reasons not associated with costs of supply.
Price discrimination takes us away from the standard assumption in that there is a single profit- maximising price for the same good or services.
For e.g. – The senior citizen discount on the train berths. Student discount in the Science Museum.
9. Explain the concept of price discrimination under monopoly form of market.
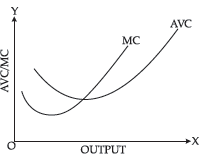
Answer : (i) When MC is less than AVC, AVC falls with increase in output.
(ii) When MC is equal to AVC i.e., when MC and AVC curves intersect each other at point A, AVC is constant at its minimum point.
(iii) When MC is more than AVC, AVC rises with increase in output.
(iv) Thereafter, both AVC and MC rise, but MC increases at a faster rate as compared to AVC. As a result, MC curve is steeper as compared to AVC curve.
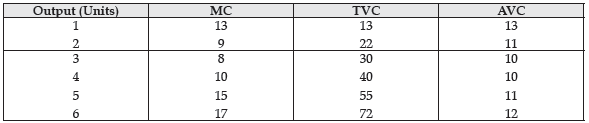
10. Explain the relationship between Marginal Cost and Average Variable Cost.
Answer : (i) When MC is less than AVC, AVC falls with increase in output.
(ii) When MC is equal to AVC i.e., when MC and AVC curves intersect each other at point A, AVC is constant at its minimum point.
(iii) When MC is more than AVC, AVC rises with increase in output.
(iv) Thereafter, both AVC and MC rise, but MC increases at a faster rate as compared to AVC. As a result, MC curve is steeper as compared to AVC curve.
Section – C
11. Explain the distinction between “decrease in supply” and “contraction in supply”. Use diagram.
Answer : “Contraction in Supply” means fall in quantity supplied due to fall in price of the good only, other factors remaining unchanged. For example, fall in supply from OQ1 to OQ2 is on account of fall in price from OP1 to OP2.
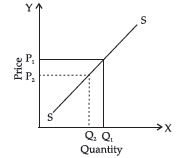
Reason for contraction in supply – Decrease in price of the commodity Other name – Downward movement along the supply curve.
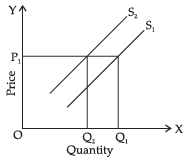
“Decrease in Supply” means fall in supply due to factor other than the price of the good. For example, fall in supply from OQ1 to OQ2 is at the same price. It means that some other factor has caused this price change.
Reason for decrease in supply:
Industrial Dispute: They lead to loss in the production of goods, leading to fall in supply and rise in prices.
Shortage of factors of production: This takes place when economy functions at full employment or close to full employment level and production of goods and services decreases.
Natural calamities: Floods, droughts, etc. greatly affect the supplies of agricultural goods and products. Shortage of food products and their raw materials, lead to the reduction of industrial goods and it also raises the production cost.
Hoarding of goods: Some traders hoard essential goods in order to earn more profit. It leads to artificial scarcity of goods in the market and also puts a lot of inflationary pressure.
12. (a) Calculate Average Variable Cost at each level of output:
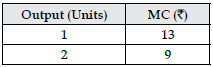
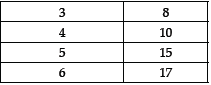
Answer :
Change in TVC is MC. Thus, by adding MC we get the TVC.
(b) What is average fixed cost of a firm ? Why is an average fixed cost curve a Rectangular Hyperbola? Explain with the help of a diagram.
Answer : Per unit fixed cost is known as Average Fixed Cost. As the value of Total Fixed Cost doesn’t very at any level of output in short run and if it is divided by an incremental number the result would be diminishing with the same proportion as that of the proportion of increases of the number of units and the product will be same.

Since TFC remains same at different levels of output, AFC falls as the level of output is increased. The AFC keeps on falling as the level of output increases. AFC can never become zero.
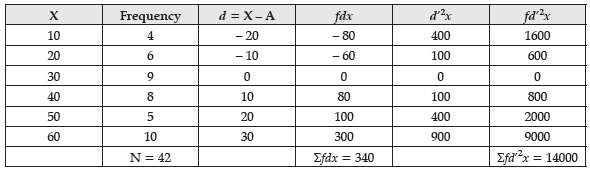
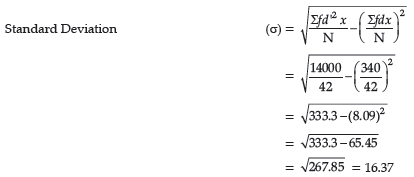
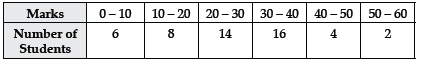
13. Find the Standard Deviation by Assumed Mean Method.
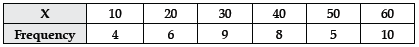
Answer :
OR
(a) Find the mean deviation about median from the following data:
Answer :

(b) List the merits of Standard Deviation.
Answer : There are following merits of standard deviation:
(i) It is rigidly defined.
(ii) It is capable of further algebraic treatment
(iii) The calculation is not difficult.
(iv) Standard deviation is considered to be an ideal measure.
(v) It is not much affected by fluctuations of sampling.