Please refer to the Class 12 Economics Sample Paper for the current academic year given below. We have provided the latest CBSE Sample Papers for Term 1 and Term 2 for Economics Class 12. All guess sample papers have been prepared based on the latest blueprint and examination pattern for the current year. All sample papers for Economics Class 12 Term 1 and 2 have been given with solutions. Students can access the multiple guess papers given below. Practicing more Class 12 Economics Sample Papers will help you to get more marks in upcoming exams.
CBSE Sample Papers for Class 12 Economics
| Term 2 Sample Papers for Class 12 Economics |
| Class 12 Economics Sample Paper Term 2 Set A |
| Class 12 Economics Sample Paper Term 2 Set B |
| Class 12 Economics Sample Paper Term 2 Set C |
Class 12 Economics Sample Paper Term 2 Set A
1. Categorise the following into stock and flow with reasons.
(a) Profits (b) Balance in bank account
OR
If real income is ₹ 400 and price index is 105, calculate nominal income.
Answer : (a) Profit is a flow as it is calculated during a period of time.
(b) Balance in bank account is a stock as it is calculated at a particular point of time.
OR
(i) Real Income = Price of base year × Quantity of Current Year
400 = 100 × Quantity of Current Year
Quantity of Current Year = 400/100 = 4
(ii) Nominal Income = Price of Current year × Quantity of Current Year = 105 × 4 = ₹ 420
2. Give the meaning of average propensity to save. What is its relation with average propensity to consume?
OR
Find national income from the following data:
Autonomous consumption = ₹ 100, Marginal propensity to consume = 0.80, Investment = ₹ 50
Answer : The ratio of aggregate saving to aggregate income is known as average propensity to save (APS). By dividing aggregate saving by aggregate income, we get APS. Symbolically,
APS = S/Y
The sum of APC and APS is equal to one. It can be proved as under:
We know, Y = C + S
Dividing both sides by Y, we get,
Y/Y = C/Y + S/Y
1 = APC + APS [ ∵ Y/Y = 1; C/Y = APC; S/Y = APS ]
APC + APS = 1 because income is either used for consumption or for savings.
OR
As given in the examination problem,
Autonomous consumption or c̅ = 100
Autonomous investment or Ī = ₹ 50
MPC or b = 0.80
So, AD = C + I = c̅ + bY + I
= 100 + 0.8Y + 50 = 150 + 0.8Y
As we know that the equilibrium level of national income in two sector model is determined where,
AS = AD;
Y = 150 + 0.8Y
Y – 0.8Y = 150; Y(1 – 0.8) = 150
Y = 150/0.2 = ₹ 750
3. What is marginal propensity to consume? How is it related to marginal propensity to save?
Answer : (i) The ratio of change in consumption (C) to change in income (Y) is known as marginal propensity to consume. It indicates the proportion of additional income that is being spent on consumption.
MPC = ΔC/ΔY
(ii) The sum of MPC and MPS is equal to one. It can be proved as under:
We know: ΔY = ΔC + ΔS
Dividing both sides by ΔY, we get,
ΔY/ΔY = ΔC/ΔY + ΔS/ΔY
1 = MPC + MPS [ ∵ ΔY/ΔY = 1; ΔC/ΔY = MPC; ΔS/ΔY = MPS ]
4. Name the major indicators of health care.
OR
Why is it not an easy thing for a country like India to maintain employment growth at 2%?
Answer : Following are the major indicators of health care:
(i) Infant mortality rate
(ii) Maternal mortality rate
(iii) Life expectancy
(iv) Nutrition levels
(v) Global burden of disease
OR
It is not an easy thing for a country like India to maintain employment growth at 2% because of:
(i) Huge Population: 2% jobs means 24 crores jobs per annum.
(ii) Craze for capital intensive techniques: Indian industrialists have a craze for capital intensive techniques.
(iii) Ignorance of cottage and small scale industries: In India, cottage and small scale industries are not being given as much importance as required.
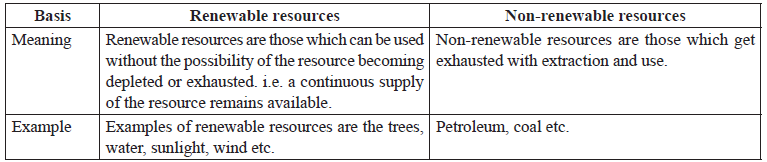
5. Differentiate between renewable and non-renewable resources.
Answer : Difference between renewable and non-renewable resources is summarised below:
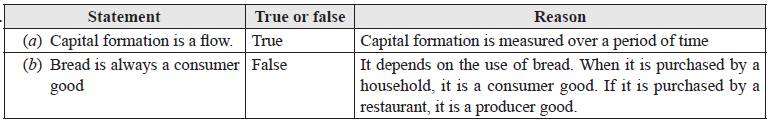
6. Are the following statements true or false? Give reasons.
(a) Capital formation is a flow
(b) Bread is always a consumer good
OR
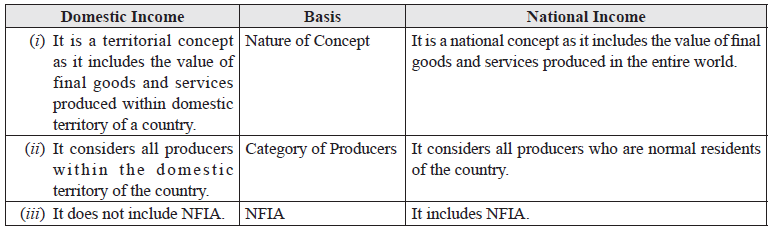
Distinguish between domestic product and national product. When can domestic product be more than national product?
Answer :
OR
7. Why are women paid fewer wages for the same work as compared to men?
Answer : Women are paid fewer wages for the same work as compared to men because:
(i) There are rules but these are not followed especially in informal sector.
(ii) There is a social prejudice which claims that males are more productive than females.
(iii) Males are more committed to their work life. Females have dual responsibility which reduces their commitment to their wok life.
(iv) Since females do not have complete financial responsibility, they agree to work for lower wages.
(v) Males have better physical abilities as compared to females.
Read the following text carefully and answer question number 8 and 9 given below:
Population growth in India and China
In both China and India, the gap between births and deaths is narrowing, resulting in slower population growth in both nations, as shown in Figure 2.7. Population growth rates are expected to be lower in China than in India throughout the 2000–2035 period. India’s population growth rate has been declining since before 2000 and is expected to do so at about the same rate throughout the period shown. By contrast, although China’s population growth rate is considerably lower than India’s, China’s rate is quite flat between 2002 and 2011 but is expected to fall somewhat more rapidly than India’s thereafter. Beginning in 2027, the number of deaths in China is expected to exceed the number of births, resulting in natural population loss.
Age-Sex Structure of the Population
The trends in fertility and mortality discussed above affect the present and projected age distribution of a population. Demographers typically use population pyramids to depict the age and sex structure of a population. Such figures are called pyramids because, historically for most nations, particularly in those with persistently high fertility rates, they resemble a pyramid, with a wide base representing large numbers of younger age groups and more narrow bands near the top representing smaller numbers of older people near the end of their natural life span.
Women in the Economy
A significant determinant of future economic growth in both countries will be the degree to which women participate in the formal economy (Apps and Rees, 2001; Bloom et al., 2009; Fortin, 2009). In both countries, women are much less likely to participate in the formal labor force than men are, but the difference is much greater in India. In 2006, 69 percent of women in China participated in the formal economy, while in India the rate was only 34 percent (Cook and Chen, 2007).
Attitudes regarding women’s roles are presently more permissive in China than in India. For example, 87 percent of Chinese respondents to the World Values Survey feel that a university education is as important for a girl as for a boy, compared with 50 percent in India (World Values Survey Association, 2009; DaVanzo, Dogo, and Grammich, forthcoming). As a consequence, China appears better positioned than India to welcome women into the formal workforce.
8. What are implications of Age-sex structure of the population?
Answer : Implications of age sex structure for an economy:
(i) The trends in fertility and mortality affect the present and projected age distribution of a population.
(ii) They determine worker population ratio, youth population and the number of workers available to contribute to GDP of the economy.
(iii) They also determine dependency ratio. Higher is the dependency ratio, worse it is for the economy.
9. How do you think China has better position in terms of role of woman in the economy?
Answer : China is better positioned when it goes ot role of women in the economy because
(i) In both countries, women are much less likely to participate in the formal labor force than men are, but the difference is much greater in India. In 2006, 69 percent of women in China participated in the formal economy, while in India the rate was only 34 percent.
(ii) Attitudes regarding women’s roles are presently more permissive in China than in India. For example, 87 percent of Chinese respondents to the World Values Survey feel that a university education is as important for a girl as for a boy, compared with 50 percent in India.
(iii) Woman is considered as productive as a man in Chinese culture and no such stereotypes exist that woman cannot handle certain professions.
As a consequence, China appears better positioned than India to welcome women into the formal workforce.
10. Explain the circular flow of income.
Answer : (i) It refers to flow of money, income or the flow of goods and services across different sectors of the economy in a circular form.

(ii) So, in case of two sector economy, we derive the following:
(a) Total production of goods and services by firms = Total consumption of goods and services by household sector.
(b) Factor payments by firms = Factor incomes of household sector.
(c) Consumption expenditure of household sector = Income of firm.
(d) Hence, Real flows of production and consumption of firms and households = Money flows of income and expenditure of firms and households.
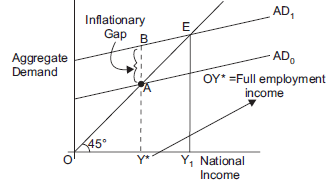
11. Define and represent inflationary gap on a diagram. Explain the role of ‘open market operations’ in removing it.
Answer : Inflationary gap is the gap showing excess of current aggregate demand over aggregate supply at the level of full employment. It is called inflationary because it leads to inflation (continuous rise in prices).
A simple example will further clarify it. Let us suppose that an imaginary economy by employing all its available resources can produce 10,000 quintals of rice. If aggregate demand of rice is say 12,000 quintals, this demand will be called an excess demand, because aggregate supply at level of full employment of resources is only 10,000 quintals as the result of the gap of 2000 quintals will be called as inflationary gap. In the below diagram Inflationary gap is AB because at Full employment Y*, Aggregate demand (BY*) is greater than Aggregate Supply (AY*).
Open market operation consists of buying and selling of government securities and bonds in the open market by central bank.
In a situation of excess demand leading to inflation, central bank sells government securities and bonds to commercial bank. With the sale of these securities, the power of commercial bank to give loans decreases, which will control excess demand.
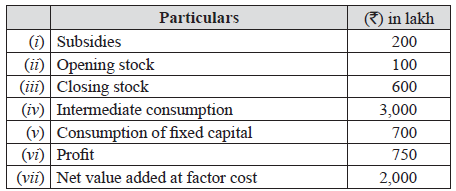
12. (a) Calculate ‘Sales’ from the following data:
(b) If the real GDP is ₹ 400 and nominal GDP is ₹ 450, calculate the price index (base = 100).
OR
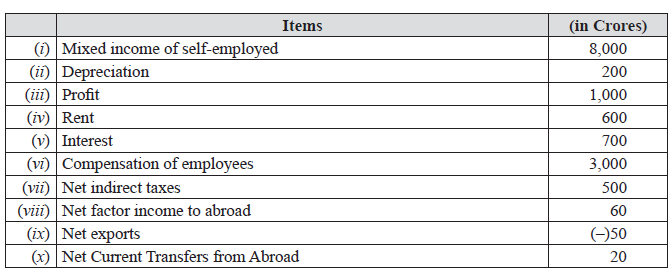
(a) Calculate the Net National Product at market price.
(b) What are ‘subsidies’?
Answer : (a) GVAMP = Net value added at factor cost (NVAFC) + Depreciation (Consumption of fixed capital) + Net indirect tax (Indirect tax – Subsidy)
= (vii) + (v) + [0 – (i)]
= 2,000 + 700 + [0 – 200]
= ₹ 2,500 Lakh
Gross Value Added (GVAMP) = Gross value of output (GVOMP) – Intermediate Consumption
= Sales + Change in stock (Closing stock – Opening Stock) – Intermediate Consumption
2,500 = Sales + [(iii) – (ii)] – (iv)]
2,500 = Sales + (600 – 100) – 3,000
2,500 = Sales – 2,500
Sales = 2,500 + 2,500 = ₹ 5,000 Lakh
(b) (i) Real GDP = Price of base year × Quantity of Current Year
400 = 100 × Quantity of Current Year
Quantity of Current Year = 400/100 = 4
(ii) Nominal GDP = Price of Current year × Quantity of Current Year
450 = Price of Current year × 4
Price of Current year = 450/4 = 112.5
(iii) Price Index = (Price of Current year/Price of Base year) × 100
= (112.5/100) × 100 = 112.5
OR
(a) NDPFC = Compensation of Employees + Operating Surplus + Mixed Income
= (vi) + (iv) + (v) + (iii) + (i)
= 3,000 + 600 + 700 + 1,000 + 8,000
= ₹ 13,300 Crores
NNPMP = NDPFC + NFIA + NIT
= 13,300 + (–viii) + (vii)
= 13,300 – 60 + 500 = ₹ 13,740 Crores
(b) Subsidies are the cash grants given by the government to the enterprises to encourage production of certain commodities, to promote exports or to sell goods at prices lower than the free market price.
13. (a) Compared to females, more males are found to be working. Why?
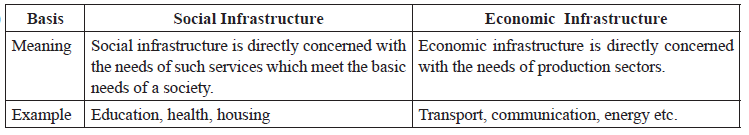
(b) Distinguish between social infrastructure and economic infrastructure.
Answer : (a) Compared to females, more males are found to be working because:
(i) Gender based social division of labour: It is assumed that men are meant to fulfill financial responsibilities and females are meant to take care of domestic chores.
(ii) Many of the household activities that are done by women are not recognised as work.
(iii) Skill requirement is also a reason.
(b)