Please refer to MCQ Questions Chapter 4 Presentation of Data Class 11 Economics with answers provided below. These multiple-choice questions have been developed based on the latest NCERT book for class 11 Economics issued for the current academic year. We have provided MCQ Questions for Class 11 Economics for all chapters on our website. Students should learn the objective based questions for Chapter 4 Presentation of Data in Class 11 Economics provided below to get more marks in exams.
Chapter 4 Presentation of Data MCQ Questions
Please refer to the following Chapter 4 Presentation of Data MCQ Questions Class 11 Economics with solutions for all important topics in the chapter.
MCQ Questions Answers for Chapter 4 Presentation of Data Class 11 Economics
Question. What is the Class Width?
a) 70
b) 60
c) 10
d) 15
Answer
C
Question. A symmetrical curve is the one which has ……… .
(a) equal area on both sides of the curve
(b) more area on the right side of the curve
(c) more area on the left side of the curve
(d) None of the above
Answer
A
Question. An asymmetrical curve is the one which has ……… .
(a) equal area on both side of the curve
(b) more area on the right side of the curve
(c) more area on the left side of the curve
(d) Either (b) or (c)
Answer
D
Question. Ogive graphs can be used to locate which of the following central tendency?
(a) Arithmetic mean
(b) Median
(c) Mode
(d) All of the above
Answer
B
Question. Headings and sub-headings given to columns are known as ……… .
(a) Stubs
(b) Captions
(c) Titles
(d) None of these
Answer
B
Question. Which of the following are methods of presentation of data?
(i) Text presentation
(ii) Semi-tabular presentation
(iii) Tabular presentation
(iv) Pictorial presentation
Choose from the options below.
(a) (i), (ii), (iii)
(b) (ii), (iii), (iv)
(c) (i), (iii), (iv)
(d) (i), (ii), (iii), (iv)
Answer
D
Question. Which of the following are essentials of a good table?
(i) Based on the objective of study
(ii) Capable of comparison
(iii) Manageable size
(iv) Attractive
Choose from the options below.
(a) (i), (ii), (iii)
(b) (ii), (iii), (iv)
(c) (i), (iii), (iv)
(d) (i), (ii), (iii), (iv)
Answer
D
Question. Compound bar diagrams are same as ……… .
(a) simple bar graph
(b) multiple bar graph
(c) sub-divided bar graph
(d) None of the above
Answer
B
Question. Accuracy is not required while drawing the diagrams. Choose from the options below.
(a) True
(b) False
(c) Partially true
(d) Incomplete statement
Answer
B
Question. Component bar graphs are also known as
(a) Sub-divided bar graph
(b) Percentage bar graph
(c) Broken scale bar graph
(d) Deviation bar graph
Answer
A
Question.The systematic presentation of raw data in row and column is called tabulation.
Choose from the options below.
(a) True
(b) False
(c) Partially true
(d) Incomplete statement
Answer
A
Question. Horizontal bar graphs are also known as
(a) Complex bar graph
(b) Simple bar graph
(c) Derived bar graph
(d) None of these
Answer
B
Question. Graphical presentation of cumulative frequency distributions is known as
(a) Frequency curve
(b) Frequency polygon
(c) Ogive graphs
(d) Histograms
Answer
C
Question. Common average lines are used when two variables are given in same unit.
Choose from the options below.
(a) True
(b) False
(c) Partially true
(d) Incomplete statement
Answer
B
Question. A curve which is drawn by joining the mid-points of a histogram using a straight line is known as
(a) Frequency polygon
(b) Frequency curve
(c) Both (a) and (b)
(d) Neither (a) nor (b)
Answer
A
Question. Frequency distribution of more than ogive curves is arranged in
(a) increasing order
(b) decreasing order
(c) constant order
(d) random order
Answer
A
Question. False base lines are used
(a) when extreme values of given series are not known
(b) when there are very less values given in the frequency distribution
(c) when there are higher values given in the frequency distribution
(d) None of the above
Answer
C
Question. Ogive graphs are drawn to represent ……… .
(a) individual series
(b) discrete series
(c) continuous series
(d) None of these
Answer
C
Question. Histograms can be used to locate which of the following central tendency?
(a) Arithmetic mean
(b) Median
(c) Mode
(d) All of these
Answer
C
Question. Which of the following is not a diagrammatic presentation?
(a) Simple bar graph
(b) Multiple bar graph
(c) Histogram
(d) Percentage bar graph
Answer
C
Question. Identify the correct sequence of alternatives given in column II by matching them with respective terms in column I.
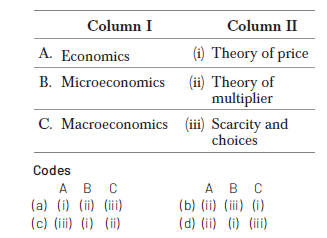
Answer
C
Question. In a pie-diagram, maximum degree is
(a) 180
(b) 240
(c) 360
(d) None of these
Answer
C
Question. Which bar graph is suitable for representing data with two extreme values?
(a) Broken bar graph
(b) Percentage bar graph
(c) Multiple bar graph
(d) Deviation bar graph
Answer
A
Question. Which of the following is not an objective of classification of data?
(a) To simplify complex data
(b) To facilitate comparison
(c) To enhance human understanding
(d) All of the above are objectives of classification
Answer
D
Question. Which of the following method(s) of statistics is followed by collection of primary data in a statistical enquiry?
(a) Classification
(b) Organisation
(c) Presentation
(d) Both (a) and (b)
Answer
D
Question. The main part of table is known as
(a) Body
(b) Heading
(c) Footnote
(d) None of these
Answer
A
Question. Which of the following is/are essentials of a good classification?
(a) It should comprised of all the items of the population
(b) It should be simple and clear
(c) It should be comprised of all related instruction of understanding
(d) All of the above
Answer
D
Question. Choose the correct statement out of the following.
(a) Histograms of inclusive series can only be constructed when converted into exclusive series
(b) Mid value series should be converted into normal frequency distribution in order to draw frequency polygon
(c) Frequency curves are drawn by joiningmid points of histograms by a straight line
(d) It is not possible to construct a histogram if frequency distribution is unequal
Answer
A
Question. Histogram always starts from the origin.
Choose from the options below.
(a) True
(b) False
(c) Partially true
(d) Incomplete statement
Answer
C
Question. Class frequencies of a series are also known as
(a) Ogive
(b) Frequency polygon
(c) Histogram
(d) None of the above
Answer
D
Question. Choose the incorrect statement from the given below.
(a) Width of the bar diagrams can vary
(b) Length of the bar diagram can be different
(c) Gaps within each bar should not vary
(d) Proper scale should be used for construction of bar diagrams
Answer
A
Question. Which of the following is/are parts of graphic presentation?
(a) Graphs of frequency distribution
(b) Graphs of time series
(c) Both (a) and (b)
(d) Neither (a) nor (b)
Answer
C
Question. Choose the correct statement from the given below.
(a) Diagrams cannot show a large number of facts at a time.
(b) Diagrams can show only approximated values.
(c) Diagrams as a means of drawing conclusions, can be misused.
(d) All of the above is correct
Answer
D
Question. Cubes are an example of three dimensional diagram.
Choose from the options below.
(a) True
(b) False
(c) Partially true
(d) Incomplete statement
Answer
A
Question. When the vertices of frequency polygon are joined by a smooth curve,it is called as ……… .
(a) Line graph
(b) Curve
(c) Frequency curve
(d) None of the above
Answer
C
Question. Histograms are rectangular bar graphs which are used to represent ……… .
(a) individual series
(b) discrete series
(c) continuous series
(d) None of these
Answer
C
Question. One-dimensional diagrams are also known as
(a) Simple bar graphs
(b) Multiple bar graphs
(c) Both (a) and (b)
(d) Neither (a) nor (b)Codes
(a) A – (i)
(b) B – (ii)
(c) C – (iii)
(d) All of the above pairs are incorrect
Answer
C
Question. Line frequency graphs are also known as
(a) Times series graphs
(b) Arithmetic graph
(c) Both (a) and (b)
(d) Neither (a) nor (b)
Answer
C
Question. Look at the graph given below.

This is an example of
(a) complex bar graph
(b) broken scale bar graph
(c) sub-divided bar graph
(d) None of the above
Answer
B
Question. Which of the following parts of a table is/are optional?
(a) Headnote
(b) Footnote
(c) Both (a) and (b)
(d) Neither (a) nor (b)
Answer
C
Question. Write the correct pair Codes
(a) A – (i)
(b) B – (ii)
(c) C – (iii)
(d) D – (iv)
Answer
B
Question. General purpose table is also referred to as
(a) Repository table
(b) Original table
(c) Both (a) and (b)
(d) Neither (a) nor (b)
Answer
A
Question. Which of the following should be kept in mind while constructing a diagram?
(a) According to the page size
(b) Properly scaled
(c) Simple and clear
(d) All of the above
Answer
D
Question. Simple bar graphs are suitable for…… .
(a) attributes
(b) frequency distribution
(c) cumulative frequency distribution
(d) All of the above
Answer
B
Question. A simple bar graph can be drawn
(a) vertically
(b) horizontally
(c) Both (a) and (b)
(d) Neither (a) nor (b)
Answer
C
Question. The main objective of tabulation is
(a) to simplify complex data
(b) to present data in a definite form
(c) Both (a) and (b)
(d) Neither (a) nor (b)
Answer
C
Question. Which of the following is/are part(s) of a table?
(a) Stubs
(b) Captions
(c) Title
(d) All of these
Answer
D
Question. Tabulation makes the data complex.
Choose from the options below.
(a) True
(b) False
(c) Partially true
(d) Incomplete statement
Answer
B
Question. The use of class mark instead of actual values of the observation involves considerable
(a) Loss of Importance
(b) Gain of Importance
(c) Profit of Importance
(d) All of the above
Answer
A
Question. _________all units of population don’t have equal chance of being selected.
(a) Random
(b) Lottery Method
(c) Choice
(d) None
Answer
D
Question. Sub-divided bar diagram are also called _____ diagram
(a) Component Bar
(b) Ogive
(c) Pie chart
(d) None
Answer
A
Question. The sum of frequencies for all classes will always equal
(a) a value between 0 to 1
(b) the number of classes
(c) the number of elements in a data set
(d) 1
Answer
C
Question. Database on first-hand information is called
(a) Primary Data
(b) Secondary Data
(c) A is False
(d) B is False
Answer
A
Question. The Questionnaire should be ____________ to understand and avoid different words.
(a) Lengthy
(b) Easy
(c) Perfect
(d) Simple
Answer
B
Question. First step of presentation of data is:
(a) Categorisation
(b) Tabulation
(c) Both (i) and (ii)
(d) None of these.
Answer
A
Question. Quartile is a type of:
(a) mathematical average
(b) statistical average
(c) partition value
(d) none of these
Answer
C
Question. In what type of papers pictures are drawn:
(a) Graph paper
(b) White paper
(c) Any
(d) None of these.
Answer
B
Question. When is ‘India’s coalition done:
(a) Every first year of every decade
(b) Every first year of century
(c) Every year
(d) Every five year.
Answer
A
Question. Which law should be kept is mind while and making tables:
(a) Correct size
(b) Correct measurement of unit
(c) Correct unit
(d) All of these.
Answer
D
Question. Class Mid-point or Class Mark is equal to
(a) (Upper class limit – Lower class limit) /2
(b) (Upper class limit + Lower class limit) / 2
(c) (Upper class limit + Lower class limit) * 2
(d) (Upper class limit – Lower class limit) * 2
Answer
B
Question. Which of the following is not a type of non-sampling error?
(a) Sampling Bias
(b) Non-response
(c) Errors in data
(d) Difference between sampling estimate and corresponding parameter
Answer
D
Question. In case of continuous variables, _____________ intervals are used very often.
(a) Inclusive class intervals
(b) Exclusive class intervals
(c) Online class intervals
(d) Offline class intervals
Answer
A