Students should refer to Worksheets Class 11 Economics Organisation of Data Chapter 1 provided below with important questions and answers. These important questions with solutions for Chapter 1 Organisation of Data have been prepared by expert teachers for Class 11 Economics based on the expected pattern of questions in the class 11 exams. We have provided Worksheets for Class 11 Economics for all chapters on our website. You should carefully learn all the important examinations questions provided below as they will help you to get better marks in your class tests and exams.
Organisation of Data Worksheets Class 11 Economics
1. Classification of Data: The process of grouping data according to their characteristics is known as classification of data.
2. Objectives of Classification:
a] To simplify complex data
b] To facilitate understanding
c] To facilitate comparison
d] To make analysis and interpretation easy.
e] To arrange and put the data according to their common characteristics.
3. Statistical Series: Systematic arrangement of statistical data

I. Can be on the basis of individual units :
The data can be individually presented in two forms:
i] Raw data: Data collected in original form.
ii] Individual Series: The arrangement of raw data individually. It can be expressed in two ways.
a] Alphabetical arrangement : Alphabetical order
b] Array: Ascending or descending order.
II. Can be on the basis of Frequency Distribution:
Frequency distribution refers to a table in which observed values of a variable are classified according to their numerical magnitude.
1. Discrete Series: A variable is called discrete if the variable can take only some particular values.
2. Continuous Series: A variable is called continuous if it can take any value in a given range. In constructing continuous series we come across terms like:
a] Class : Each given internal is called a class e.g., 0-5, 5-10.
b] Class limit: There are two limits upper limit and lower limit.
c] Class interval: Difference between upper limit and lower limit.
d] Range: Difference between upper limit and lower limit.
e] Mid-point or Mid Value: (Upper limit – Lower limit)/2
f] Frequency: Number of items [observations] falling within a particular class.
i] Exclusive Series: Excluding the upper limit of these classes, all the items of the class are included in the class itself. E.g., :

ii] Inclusive Series: Upper class limits of classes are included in the respective classes. E.g.,

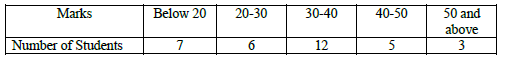
Open End Classes : The lower limit of the first class and upper limit of the last class are not given. E.g.,
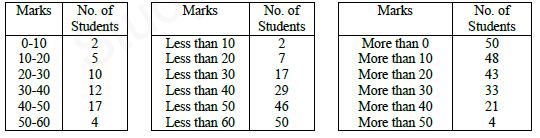
iii] Cumulative Frequency Series: It is obtained by successively adding the frequencies of the values of the classes according to a certain law.
a] ‘Less than’ Cumulative Frequency Distribution :
The frequencies of each class-internal are added successively.
b] ‘More than’ Cumulative Frequency Distribution:
The more than cumulative frequency is obtained by finding the cumulative totals of frequencies starting from the highest value of the variable to the lowest value.
E.g., :