Please refer to Class 12 Economics Sample Paper Term 2 Set B with solutions below. The following CBSE Sample Paper for Class 12 Economics has been prepared as per the latest pattern and examination guidelines issued by CBSE. By practicing the Economics Sample Paper for Class 12 students will be able to improve their understanding of the subject and get more marks.
CBSE Class 12 Economics Sample Paper for Term 2
1. Distinguish between GNP and GDP.
OR
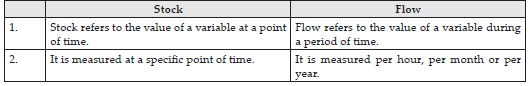
Distinguish between stocks and flows. Give an example of each.
Answer:


2. If income rises from `50,000 to `60,000 consumption increases from `40,000 to `48,000. In this situation,what will be the value of Marginal Propensity to Consume (MPC)?
OR
Suppose in a hypothetical economy, the income rises from `5,000 crores to `6,000 crores. As a result, the consumption expenditure rises from `4,000 crores to `4,600 crores. Calculate marginal propensity to consume.
Answer: MPC =ΔC/ΔY
Given, ΔC = Rs.(48,000 – 40,000) =Rs.8,000
ΔY= Rs. (60,000 – 50,000) =Rs.10,000
MPC = 8 000/10 000== 0.8
OR
Initial income = Rs.5,000 crores
New income = Rs.6,000 crores
Change in income (DY) = 6,000 – 5,000
= Rs.1,000 crores
Initial consumption = `4,000 crores
New consumption = `4,600 crores
Change in consumption (ΔY) = 4,600 – 4,000
(ΔC) = Rs.600 crores
Marginal propensity to consume =ΔC/ΔY
= 6001,000 = 0.6
3. Open market operations works as a method of credit control? Justify the given statement.
Answer: The sale or purchase of government securities by the Central Bank in open market is termed as open market operations.
To reduce credit, the government securities are sold by the Central Bank. It reduces the supply of money in the hands of commercial banks and common public. On the other hand, to increase the credit, the Central Bank purchases the securities from public which releases money in the market. In this way, the Central Bank uses open market operations as a method of credit control.
4. Explain two different categories of infrastructure.
OR
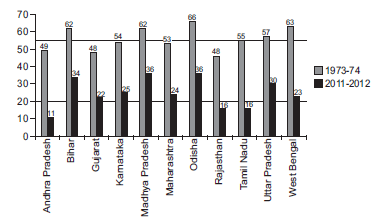
Study the graph given below showing the population below poverty line and analyse the trend of poverty from 1973 to 2012.
Note: For the year (1973, Uttar Pradesh includes the present Uttrakhand, Madhya Pradesh includes Chhattisgarh and Bihar includes Jharkhand.
Answer: The two different categories of infrastructure includes economic and social infrastructure. The economic infrastructure of the country includes all the resources that are used in the process of production of products and distribution of that products. The productivity of the country is based on the economic infrastructure available with them. On the other hand, the social infrastructure include those resources that contributes towards the improvement of human capital. The human productivity is based on the social infrastructure of the country.
OR
This graph shows state level trends in poverty.
(a) The line in the chart shows the national poverty line. The first line from below shows poverty level during 2011-12 and the other line indicates poverty level during 1973-74.
(b) The graph shows that the six states – Tamil Nadu, Uttar Pradesh, Bihar, Madhya Pradesh, West Bengal and Odissa contained a large section of poor in 1973-74.
(c) By 2012, many states reduced the poverty levels to a considerable extent.
(d) States like Odisha, Madhya Pradesh, Bihar and Uttar Pradesh are still far above from the national poverty line. West Bengal and Tamil Nadu reduced a poverty level much better than other states.
5. Salaried employees are more in urban areas than in rural areas? Justify the given statement with a valid argument.
Answer: Regular salaried employees are more in urban areas because of the following reasons:
(a) Education and Training: Urban area people are more educated and trained which is a requirement for salaried employees.
(b) Infrastructure: The urban areas are well organised and has a better infrastructure. Hence, the people in urban areas get better opportunities.
6. Which among the following are final goods and which are intermediate goods? Given valid reasons.
(a) Milk purchased by a tea stall.
(b) Bus purchased by a school.
(c) Juice purchased by a student from the school canteen.
If Real GDP is `500 and Price Index (Base = 100) is 125. Calculate the Nominal GDP
Answer: 6. (a) It is an intermediate good because it is used by teaseller during production process i.e., making tea and not for final consumption.
(b) It is a final good as, it is purchased by school for final consumption.
(c) It is a final good as, it is purchased by a student for final consumption.
OR
Real GDP is Rs.500, Price Index is 125, Nominal GDP = ?
Price Index = Nominal GDP/Real GDP× 100
125 = Nominal GDP/500× 100
Nominal GDP = 125 × 5
= 625
7. Analyse the change in occupational structure of the country on the basis of the following table:
Change in occupational structure Read the text carefully and answer the question number 8 and 9 given below.
The China-Pakistan Economic Corridor (CPEC) is an economic route stretching from Western China through Pakistan to the Indian Ocean Coast. It is a part of China’s Belt and Road Initiative.
But China’s huge investment of millions of dollars did not work for the Baloch Population. The common people of Balochistan are protesting for their basic rights to life. People are demanding basic necessities like clean drinking water, electricity, jobs, health infrastructure etc.
The amount invested in CPEC has already crossed the original budget and not even 25% of the job has been completed. Out of 122 projects announced, only 32 has been completed. There has been a 54% slump in BRI investment during the pandemic. The construction of 9 promised SEZ to be constructed has not been started.
As per Chinese officials, 80% of the investment money is getting leaked due to corruption.
Answer: From the above table, it is clear that percentage of workforce engaged in primary sector has reduced from 72.72% to 43.8%. In secondary sector, it has increased from 10.02% to 24.7%. Likewise, workforce has increased from 17.26% to 31.5% in tertiary sector. However, the shift from primary to secondary and tertiary sector is noticeable but not significant. The Indian economy is still known as agricultural economy.
8. Analyse the two consequences of non–progress of CPEC for China.
Answer: The consequences of non- progress of CPEC for China are as follows:
(a) Wastage of huge amount of money invested in CPEC project as it did not lead to fruitful returns.
(b) Trade relations got worsened due to failure on part of Pakistan.
9. Suggest three ways which Pakistan can adopt for the progress of CPEC project.
Answer: Following are the ways Pakistan can adopt for the progress of CPEC project:
(a) Provision of basic necessities to the people of Balochistan will ensure the removal of hurdles in the progress of projects.
(b) Providing job opportunities to the people of Balochistan will ensure the active participation in the projects.
(c) A check on corruption will certainly help so as to ensure that money invested is optimally utilised.
10. Explain the role of the following in correcting the inflationary gap in an economy.
(a) Legal reserves
(b) Bank rates
Answer: The problem of excess demand or inflationary gap can be corrected by adopting following monetary measures:
(a) Legal Reserve or Cash Reserve Ratio: Legal reserves or Cash Reserve Ratio (CRR) is the minimum fraction of the total deposits with the commercial banks, which they are required to keep with the central bank. The central bank increases the CRR to correct the situation of excess demand or inflationary gap in the economy. High CRR reduces the supply of money in the economy, and thus,
the Aggregate Demand will fall.
(b) Bank Rate: Bank rate is the minimum rate at which the Central Bank discounts the first class bills of exchange and provides credit to the commercial banks. The Central Bank increases the bank rate to correct the situation of excess demand in the economy. Higher bank rate reduces the lending
capacity of the commercial banks as they get funds at a higher interest rate from the Central Bank.
Consequently, money supply contracts in the economy as the public borrows less at high rate of interest and Aggregate Demand falls.
11. “Taxation is an effective tool to reduce the inequalities of income”. Justify the given statement with valid reasons.
Answer: Taxation is an effective tool to reduce the inequalities of income.” It means government reduces inequalities in income and wealth by taxing the rich more and spending more on the poor. Further, it provides for the employment opportunities to poor that help them to earn. Government through fiscal tools of taxation, subsidies and transfer payments brings about ‘fair’ distribution of income. Equitable distribution of income and wealth is a way to bring social justice
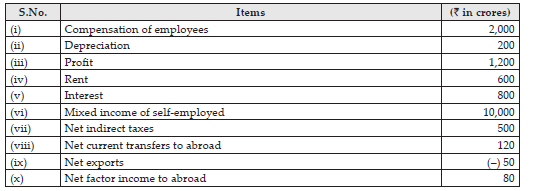
12. (a) Calculate the Net National Product at Market Price from the given details:
(b) Differentiate between personal income and private income.
OR
(a) Suppose the Gross Domestic Product (GDP) of Nation X was `2,000 crores in 2018-19, whereas the Gross Domestic Product of Nation Y in the same year was `120,000 crores. If the Gross Domestic Product of Nation X rises to `4,000 crores in 2019-20 and the Gross Domestic Product of Nation Y rises to `200,000 crores in 2019-20.
Compare the rate of change of GDP of Nations X and Y, taking 2018-19 as base year.(b) Explain the circular flow of income.
Answer: (a) Net Domestic Product at Factor Cost (NDPFC)
= Compensation of Employees + Rent + Interest + Profit + Mixed Income of Self-Employed
= 2,000 + 600 + 800 + 1,200 + 10,000 = Rs.14,600 crores
Net National Product at Market Price (NNPMP)
= NDPFC – Net Factor Income to Abroad + Net Indirect Taxes = 14,600 – 80 + 500
= Rs.15,020 crores
(b) Mentioned below are the points of differences between personal income and private income:

OR
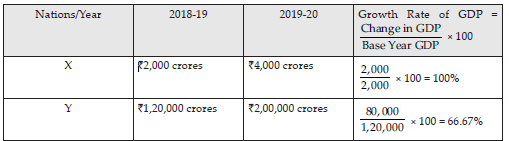
Nation X has registered a GDP growth rate of 100% and has performed better on the front of GDP rises as compared to nation Y that has registered a GDP growth rate of 66.67%.
(b) Circular flow of income refers to the unending flows of production of goods and services, income,and expenditure in an economy. It circularly shows the redistribution of income between production units (firms) and households. It can be better understood with this diagram.

Phases of Circular Flow of Income: There are three different phases (generation, distribution, and disposal) in a circular flow of income, as shown in the given diagram
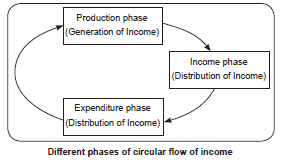
(i) Generation phase: In this phase, firms produce goods and services with the help of factor services.
(ii) Distribution phase: It involves the flow of factor income (rent, wages, interest, and profit) from firms to the households.
(iii) Disposal phase: In this phase, the income received by factors of production is spent on the goods and services produced by firms.
Income is first generated in production units, then distributed to households, and finally spent on goods and services produced by these units to make the circular flow complete its course.
13. (a) Low employment among women is a reflection of economic backwardness of a country.
In the light of above statement, suggest the measures to increase employment opportunities for women.
(b) Do you think health inequality exists even in the health infrastructure in India?
Support the statement with reasons for your answer.
Answer: (a) The measures to increase the employment opportunities for women are :
(i) Education and training opportunities for women should be further expanded, diversified and made more easily accessible.
(ii) Residential accommodation for working mothers should be increased.
(iii) There should be much more facilities of creches and child care during the working hours of mothers.
(iv) There should be large scale publicity and building of public opinion in favour of employment of women.
(b) The development of health infrastructure has shown gender, income and regional biasness in India.
Rural areas do not have access to or cannot afford medical care. Even though majority of population lives in rural areas, only one-fifth of India’s hospitals are located in rural areas with only half the number of dispensaries. Out of 7 lakh beds, roughly 11 % of them are available in rural areas. The PHCs in rural areas do not offer basic medical care like X-ray or blood testing devices.
In rural areas, the percentage of people who have no access to proper aid has risen from 15 in 1986 to 24 in 2003. States like Bihar, Madhya Pradesh, Rajasthan and Uttar Pradesh are relatively lagging behind in healthcare facilities