Class 10 Maths Statistics Worksheets have been designed as per the latest pattern for CBSE, NCERT and KVS for Grade 10. Students are always suggested to solve printable worksheets for Mathematics Statistics Grade 10 as they can be really helpful to clear their concepts and improve problem solving skills. We at worksheetsbag.com have provided here free PDF worksheets for students in standard 10 so that you can easily take print of these test sheets and use them daily for practice. All worksheets are easy to download and have been designed by teachers of Class 10 for benefit of students and is available for free download.
Mathematics Statistics Worksheets for Class 10
We have provided chapter-wise worksheets for class 10 Mathematics Statistics which the students can download in Pdf format for free. This is the best collection of Mathematics Statistics standard 10th worksheets with important questions and answers for each grade 10th Mathematics Statistics chapter so that the students are able to properly practice and gain more marks in Class 10 Mathematics Statistics class tests and exams.
Chapter-wise Class 10 Mathematics Statistics Worksheets Pdf Download
Question. If the mean of a data is 27 and its median is 33. Then, the mode is
(A) 30
(B) 43
(C) 45
(D) 47
Answer
C
Question. Which measure of central tendency is obtained graphically as the x-coordinate of the point of intersection of the two ogives?
(A) Mean
(B) Median
(C) Mode
(D) None of these
Answer
B
Question. For finding the mean by using the formula x =A+h (∑f1u1 /∑f1) we have ui = ?
(A) (A – x1 )/h
(B) (x1– A)h
(C) (A + x1 )/h
(D) h(x1– A)
Answer
B
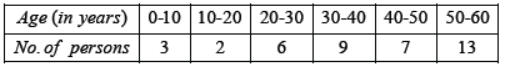
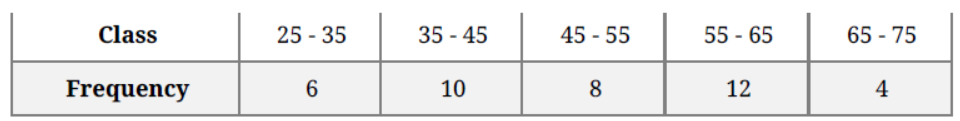
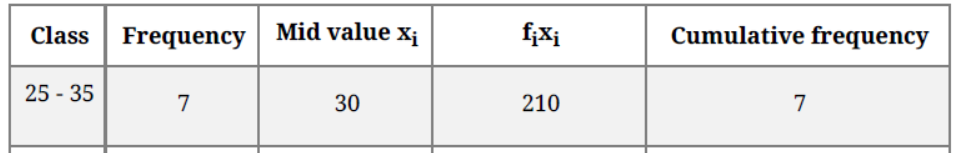
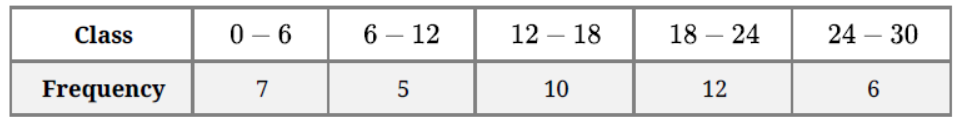
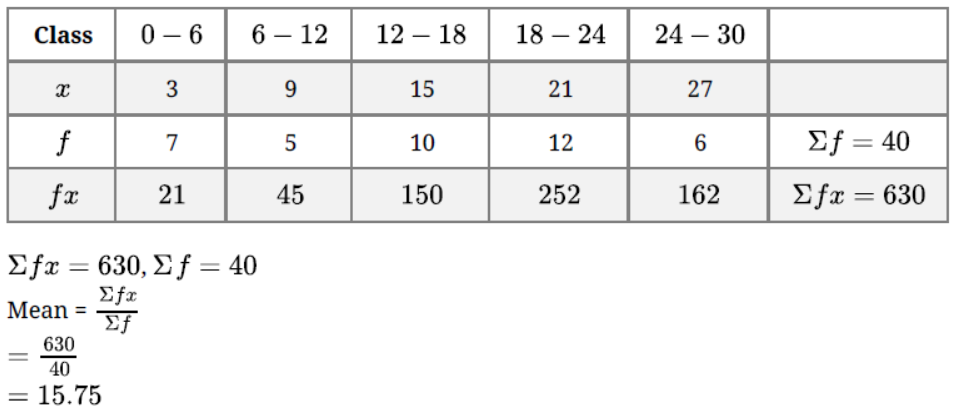
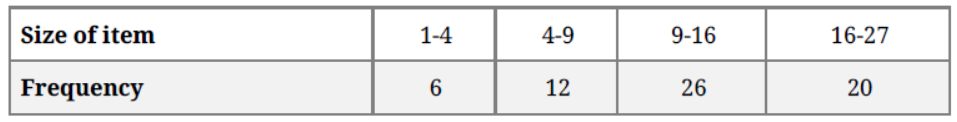
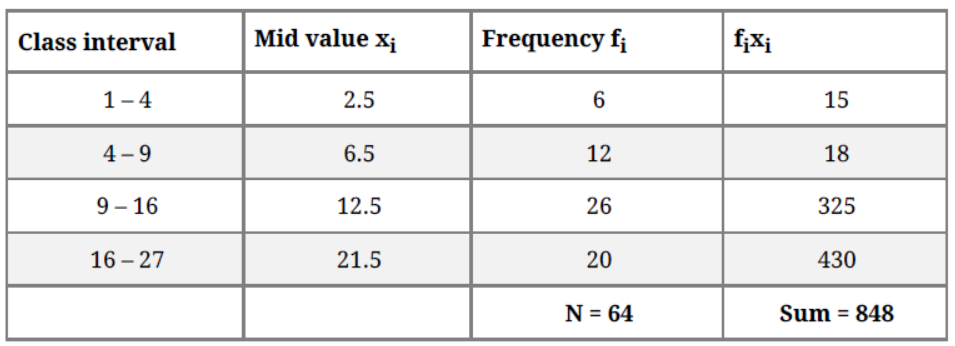
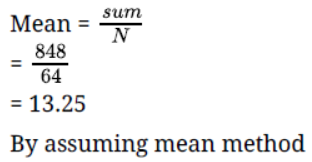
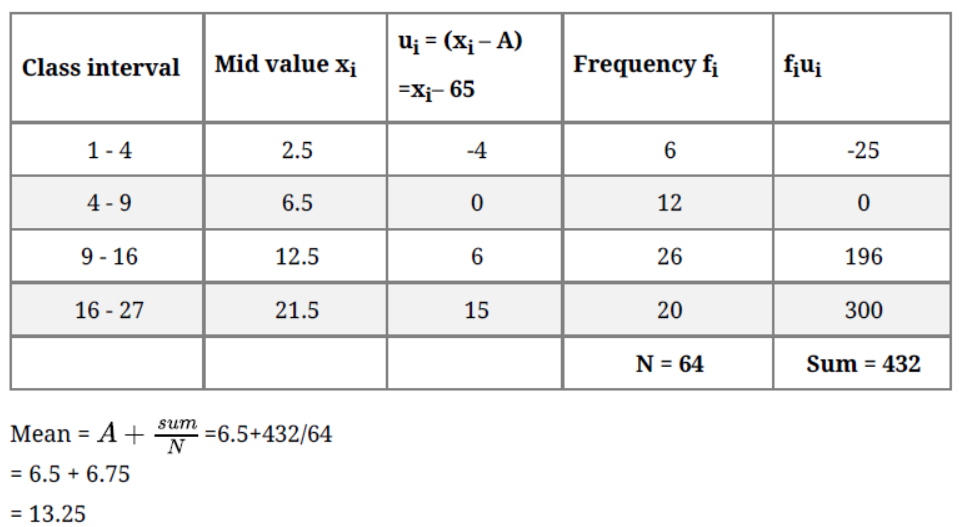
Question. Consider the following table:
The mode of the above data is
(A) 23.5
(B) 24
(C) 24.4
(D) 25
Answer
C
Question. While computing the mean of the grouped data, we assume that the frequencies are
(A) evenly distributed over the classes
(B) centred at the class marks of the classes
(C) centred at the lower limits of the classes
(D) centred at the upper limits of the classes
Answer
B
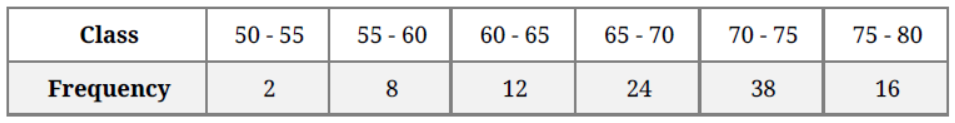
Question. Consider the frequency distribution of the heights of 60 students of a class The sum of the lower limit of the modal class and the upper limit of the median class is
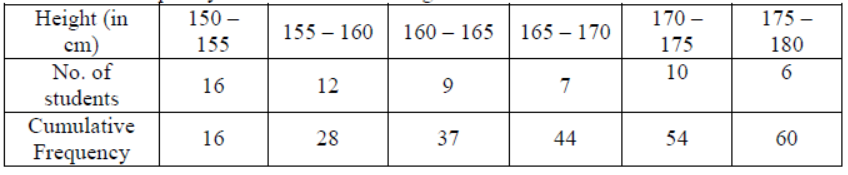
(A) 310
(B) 315
(C) 320
(D) 330
Answer
B
Question. For the following distribution:
The sum of the lower limits of the median class and the modal class is

(A) 15
(B) 25
(C) 30
(D) 35
Answer
B
Question. Consider the following frequency distribution:
The upper limit of the median class is

(A) 16.5
(B) 18.5
(C) 18
(D) 17
Answer
D
VERY SHORT ANSWER TYPE QUESTIONS
Question. Write the relation between mean, median and mode.
Answer
Mode = 3 median – 2 mean
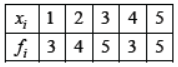
Question. The mean of five observations 3, 5, x, 9 and 11 is 7. Find x.
Answer
7
Question. What is the value of the median of the data using the graph given below :
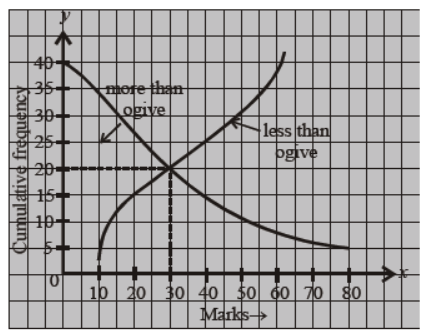
Answer
30
Question. What is the mean of first n natural numbers?
Answer
n + 1 /2
Question. What is the lower limit of median class for the following data?
Answer
20
Question. What is the median of the numbers 3, 5, 2, 7, 11, 10?
Answer
6
Question. What is the value of x if the median of the given data is 27.5? 24, 25, 26, x + 2, x + 3, 30, 32, 37
Answer
25
Question. What is the median of the following data?
Answer
25
Question. Write the following cumulative frequency distribution into frequency distribution table :
Answer
Question. What is the mode of the numbers 3, 7, 8, 11, 10, 7, 6, 3, 11, 7?
Answer
7
Question. Write the following data into less than cumulative frequency distribution table:
Answer
Question. What is the mean of first 10 prime numbers?
Answer
12.9
Question. The mean of 25 numbers is 18. If 2 is added to every number, what is the new mean?
Answer
20
Question. What measure of the central tendency is represented by the abscissa of the point where ‘less than’ and ‘more than’ ogive intersect?
Answer
median
Question. What is the mean of the following data?
Answer
3.15
Short / Long Answer type Question :
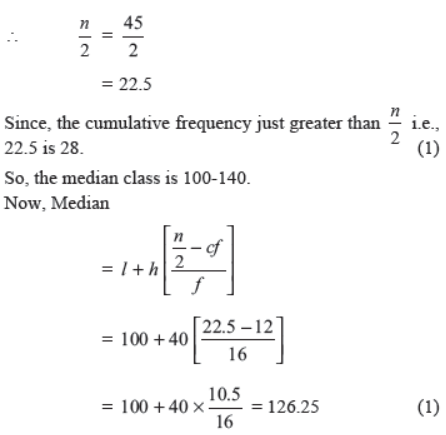
Question. The distribution given below shows the number of wickets taken by bowlers in one-day cricket matches. Find the mean and the median of the number of wickets taken.
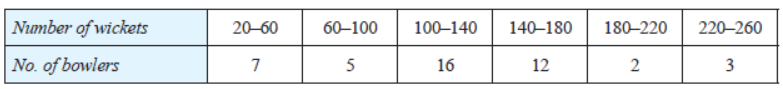
Solution. Mean:

Question. The mode of the following data is 67. Find the missing frequency x.
Solution.

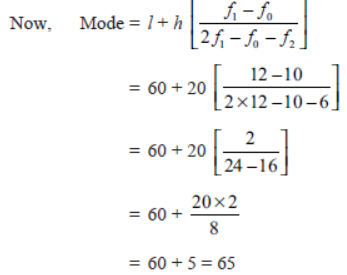
Question. Find the mode of the following data:
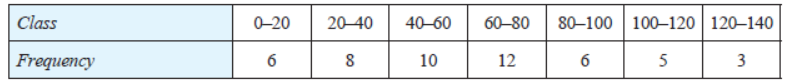
Solution. Maximum frequency = 12
∴ Modal class = 60–80
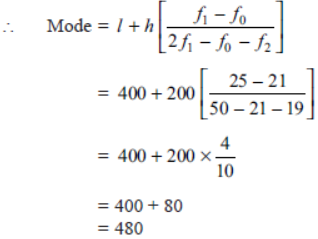
Question. The following distribution shows the transport expenditure of 100 employees:
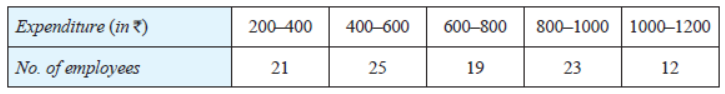
Solution. Maximum frequency = 25
So, Modal class = 400–600
Question. The weight of tea in 70 packets are as follows:

Determine the modal weight.
Solution. Modal class = 201–202 as its frequency is maximum.
∴ Modal weight

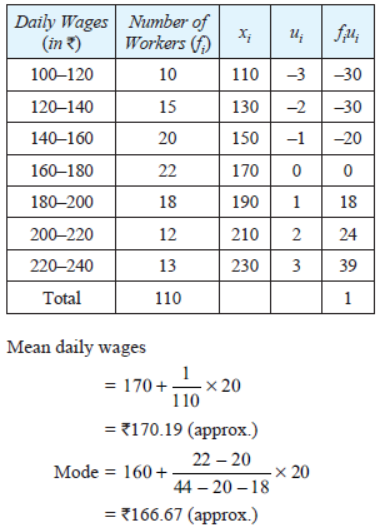
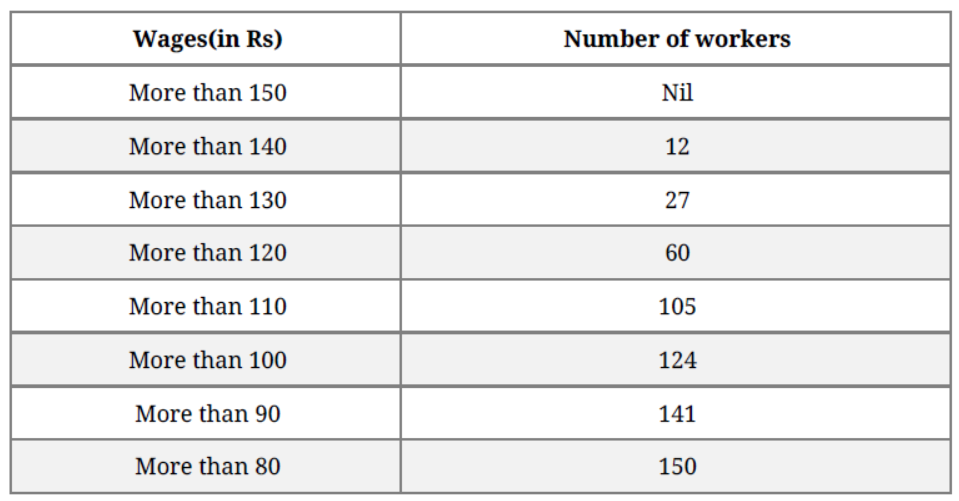
Question. Daily wages of 110 workers, obtained in a survey, are tabulated below:

Compute the mean daily wages and modal daily wages of these workers.
Solution.
Question. The annual rainfall record of a city of 100 days is given in the following table:

Calculate the median rainfall.
Solution. 39.09 cm
Question. Find the median class of following data:
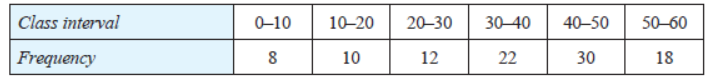
Solution.
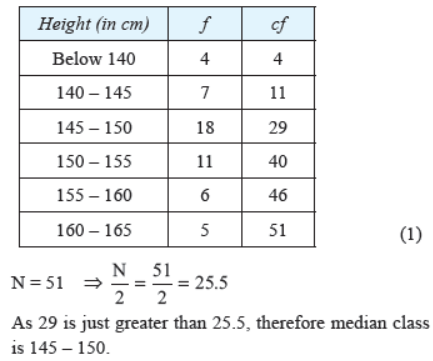
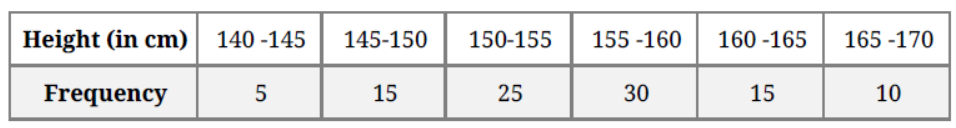
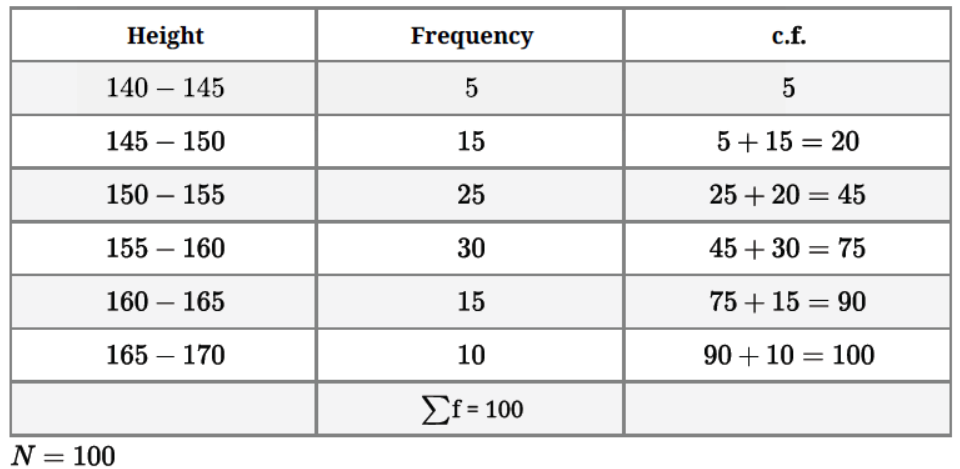
Question. A survey regarding the heights (in cm) of 51 girls of class X of a school was conducted and the following data was obtained. Find the median height and the mean using the formulae.
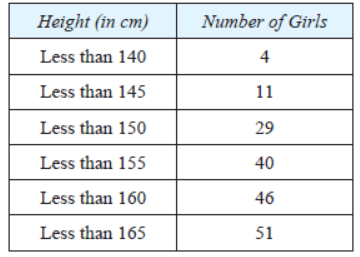
Solution. Calculating Median
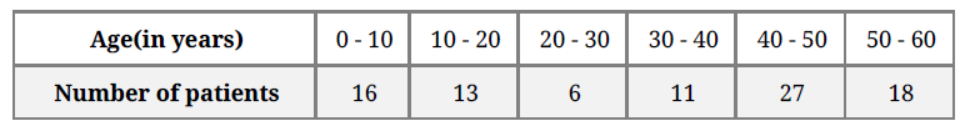
Question. The following table shows the ages of the patients admitted in a hospital during a year:
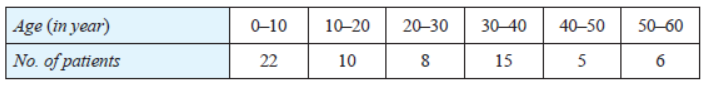
Find the median of the data given above.
Solution. 21.25 years
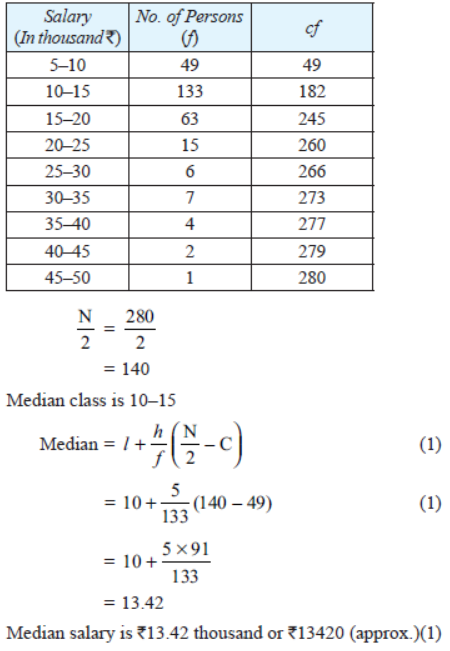
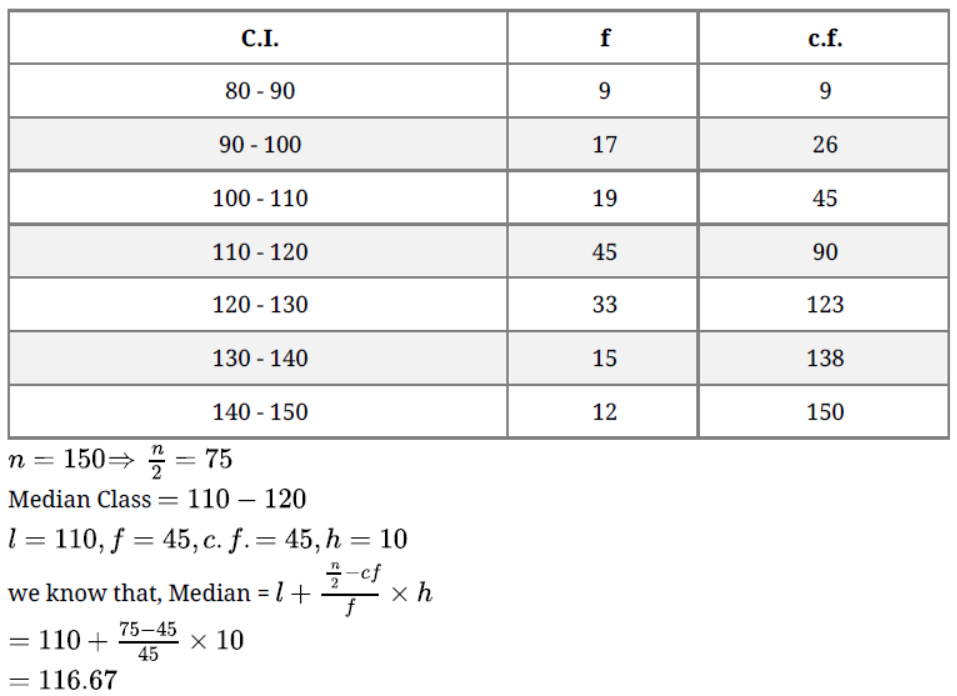
Question. The table below shows the salaries of 280 persons:
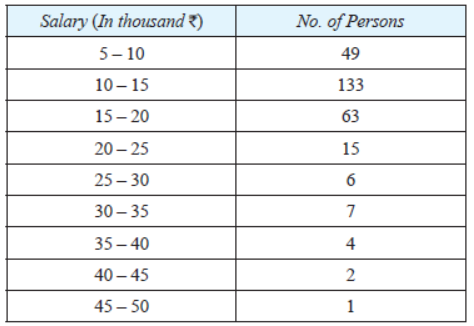
Calculate the median salary of the data.
Solution.
Question. The following data gives the information on the observed life-times (in hours) of 25 electrical components. Determine the model life-time of the components.

Solution. Modal life-time = 175 hrs.
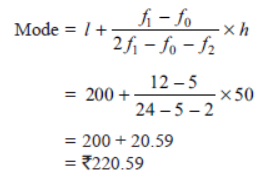
Question. The table shows the daily expenditure on grocery of 25 households in a locality. Find the modal daily expenditure on grocery by a suitable method.
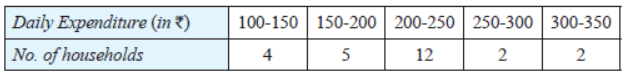
Solution. 200 – 250 is the modal class.
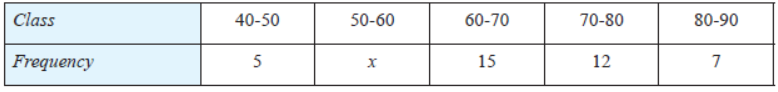
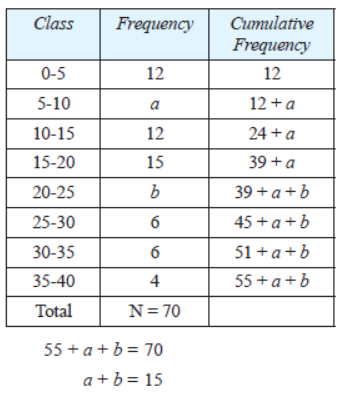
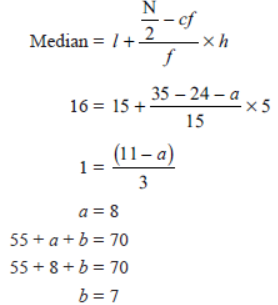
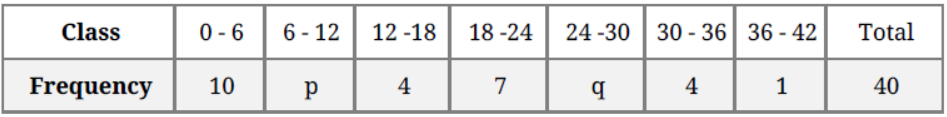
Question. The median of the following data is 16. Find the missing frequencies a and b, if the total of the frequencies is 70.

Solution.
Question. If the median of the following frequency distribution is 32.5. Find the values of f1 and f2.

Solution. Here, median = 32.5 and n = 40
Now, we have
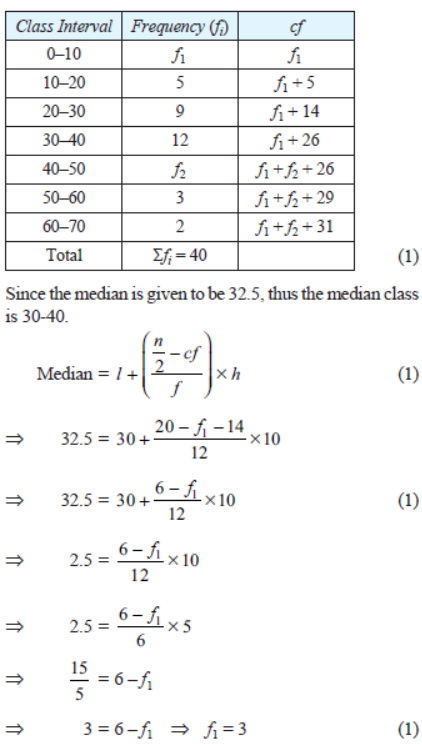
Now, f1 + f2 + 31 = 40
⇒ f2 = 9 – 3
⇒ f2 = 6
Thus, f1 = 3 and f2 = 6
Question. Compare the modal age of two groups of students A and B appearing for an entrance test.
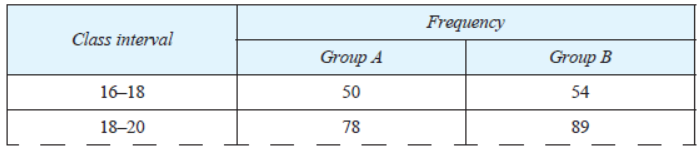
Solution. For group A, modal class is 18-20
∴ Mode of group A

Question. The median of the following data is 525. Find the values of x and y if the total frequency is 100.
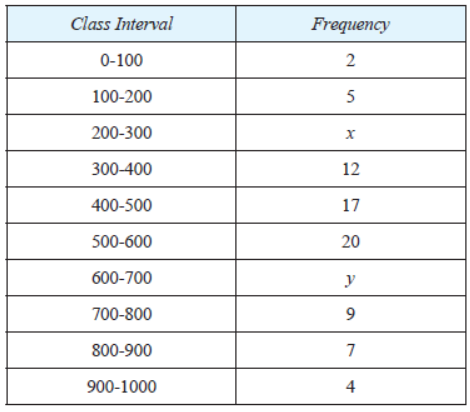
Solution.
⇒ (14 – x) × 5 = 25
⇒ x = 9, from (i), y = 15
Question. Write the modal class of the following frequency distribution:

Solution. Frequency of the class interval 30-40 is maximum,
i.e., 65. So, the modal class is 30-40.
Question. Write the median of the following data: 3, 5, 2, 9, 7, 11
Solution. 2
Question. Find the median of the following data:
Solution.

Question. The distribution below gives the marks of 30 students of a class in mathematics. Find the median marks of the students.

Solution.

Question. The marks distribution of 30 students in a science examination are as follows. Find the mode of this data.

Solution. First, we will make the class interval with class size of 15.

Since the maximum number of students (7) have got marks in the interval 40–55, the model class is 40–55.
So lower limit of the model class, l = 40
class size, h = 15
frequency, f1 of the model class = 7
frequency, f0 of the class preceding the model class = 3
frequency, f2 of the class succeeding the model class = 6
Now, using the formula
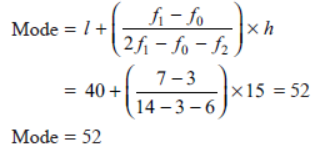
Median
The median is the middle value of a distribution i.e., median of a distribution is the value of the observation which divides
it into two equal parts.
• Median of ungrouped data:
(i) Arrange the data in ascending order.
Median of grouped data: Median of a grouped data or continuous frequency distribution can be found by using the
formula:
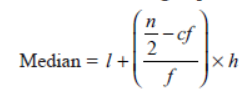
where, l = lower limit of the median class
n = number of observations
f = frequency of the median class
h = size of the median class (assuming all class sizes to be equal)
cf = cumulative frequency of the class preceding the median class
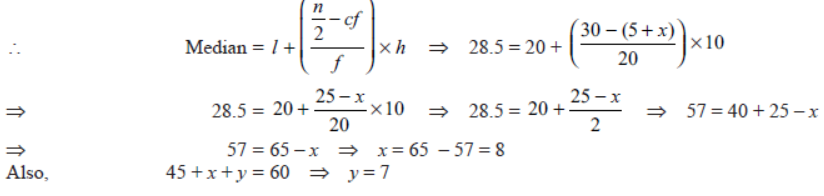
Question. If the median of the distribution given below is 28.5, find the values of x and y.
Solution. Here, median = 28.5, n = 60
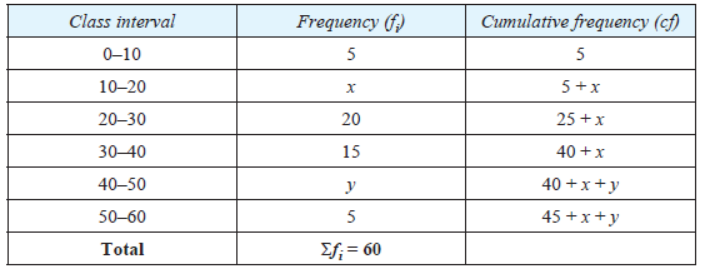
Since the median = 28.5, therefore, median class is 20–30
∴ n/2 = 30, l = 20, h = 10, cf = 5 + x, f = 20
Question. In the following frequency distribution, find the median class.
Solution.
Question. Find median of the data, using an empirical relation when it is given that Mode = 12.4 and Mean = 10.5.
Solution.

Question. Find the mode of the following distribution.
Solution.
Here the maximum frequency is 28 then the corresponding class 40 – 52 is the modal
class
l = 40, h = 50 – 40 = 10, f = 28, f1 = 12, f2 = 20
Question. Convert the following data into ‘more than type’ distribution:
Solution.


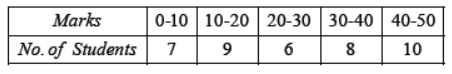
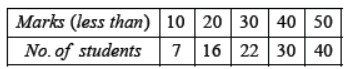
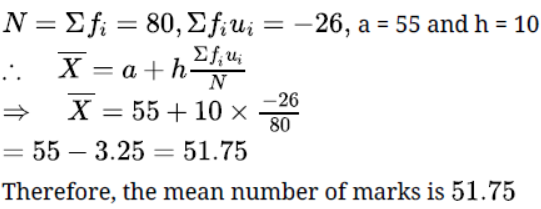
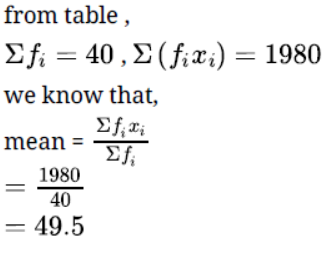
Question. Find the mean marks of students from the following cumulative frequency distribution:
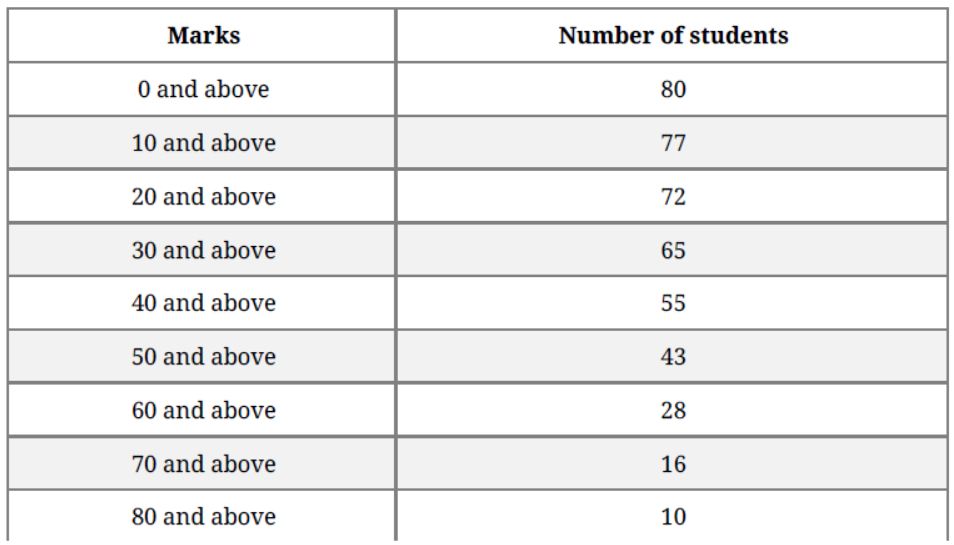

Solution. Here we have, the cumulative frequency distribution.
So, first we convert it into an ordinary frequency distribution.
We observe that there are 80 students getting marks greater than or equal to 0 and 77
students have secured 10 and more marks.
Therefore, the number of students getting marks between 0 and 10 is 80 – 77 = 3.
Similarly, the number of students getting marks between 10 and 20 is 77 – 72 = 5 and
so on.
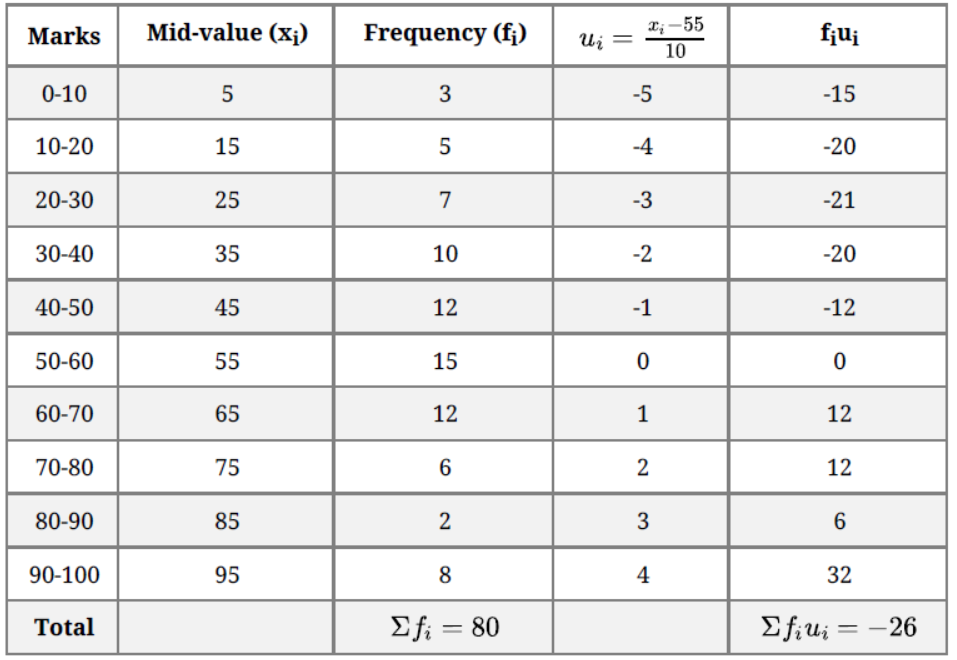
Let assumed mean (a) = 55.
We have,
Question. Calculate the mean of the following data, using direct method:
Solution.
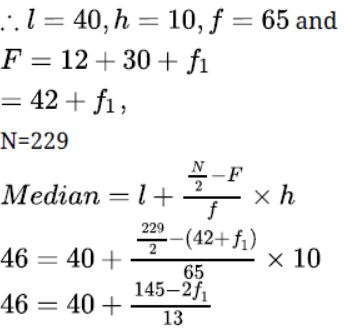
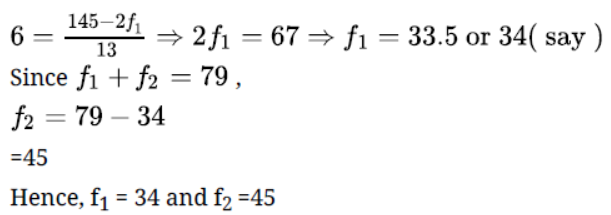
Question. If the median of the following frequency distribution is 46, find the missing frequencies.

Solution. Let the frequency of the class 30 – 40 be f1 and that of the class 50 – 60 be f2. The total
frequency is 229.
12 + 30 + f1 + 65 + f2 + 25 + 18 =229
f1 + f2 =79
It is given that the median is 46
Clearly, 46 lies in the class 40 – 50. So, 40 – 50 is the median class.
Question. Find median for the following data:
Solution.
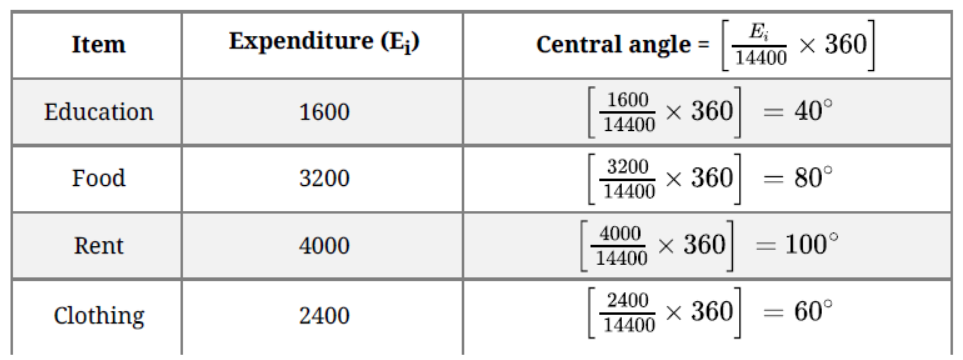
Question. Draw a pie-chart for the following data of expenditure on various items in a family.
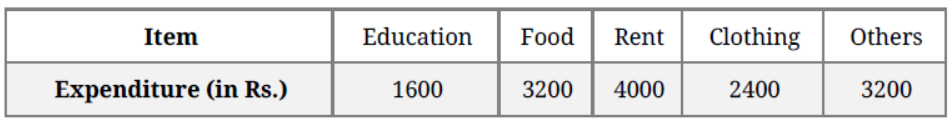
Solution.
Question. Find the mean and mode of the following frequency distribution:
Solution.
Question. From the following frequency distribution, prepare the ‘more than’ ogive.
Also, find the median.
Solution. More than series:

plot the points (400, 230), (450, 210), (500, 175), (550, 135), (600, 103), (650, 79), (700, 52), (750, 34).
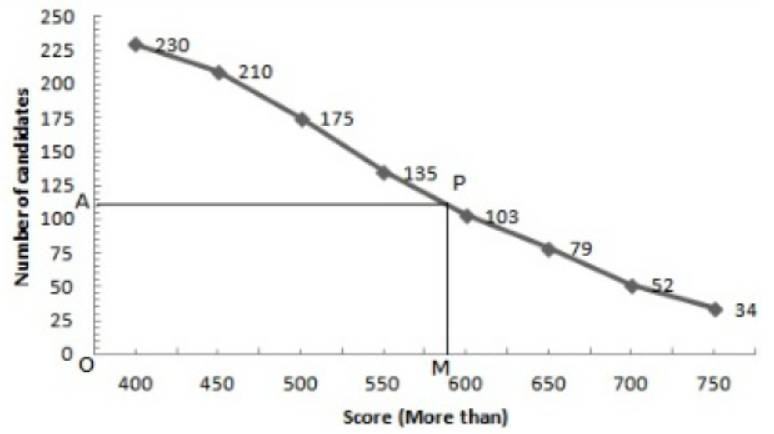
Take a point A(0, 115) on the y-axis and draw AP||x-axis meeting the curve at P, Draw
PM x-axis intersecting x-axis at M
OM = 590
Hence, median = 590
Question. Find the mode of the given data 3, 3, 7, 4, 5, 3, 5, 6, 8, 9, 5, 3, 5, 3, 6, 9, 7, 4.
Solution.

We observe that the value 3 has the maximum frequency i.e 5 .
The mode of data is 3.
Question. If the median of a series exceeds the mean by 3, find by what number the mode exceeds its mean?
Solution.
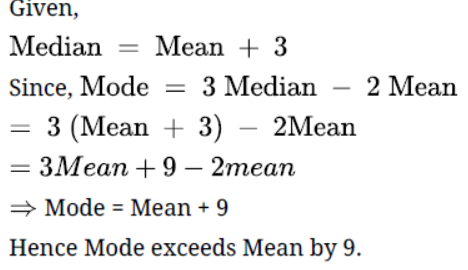
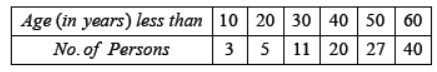
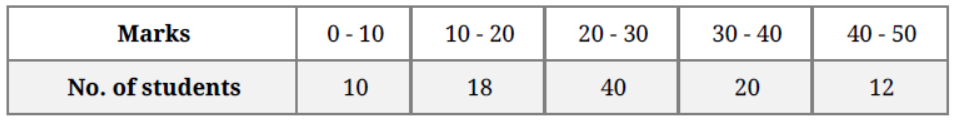
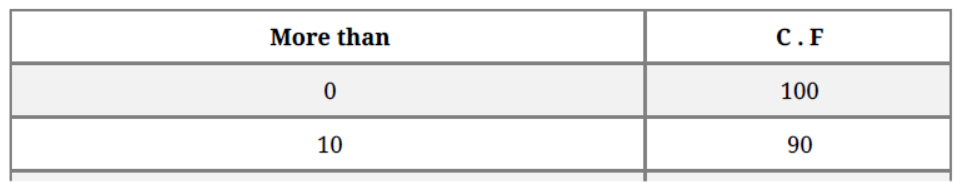
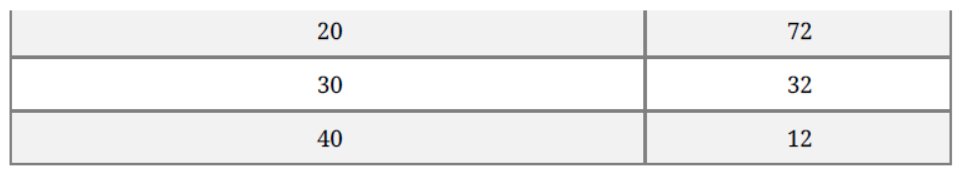
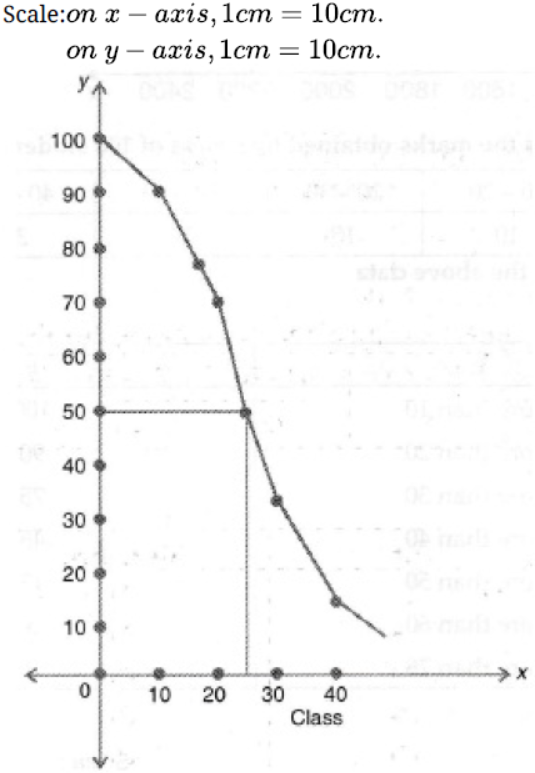
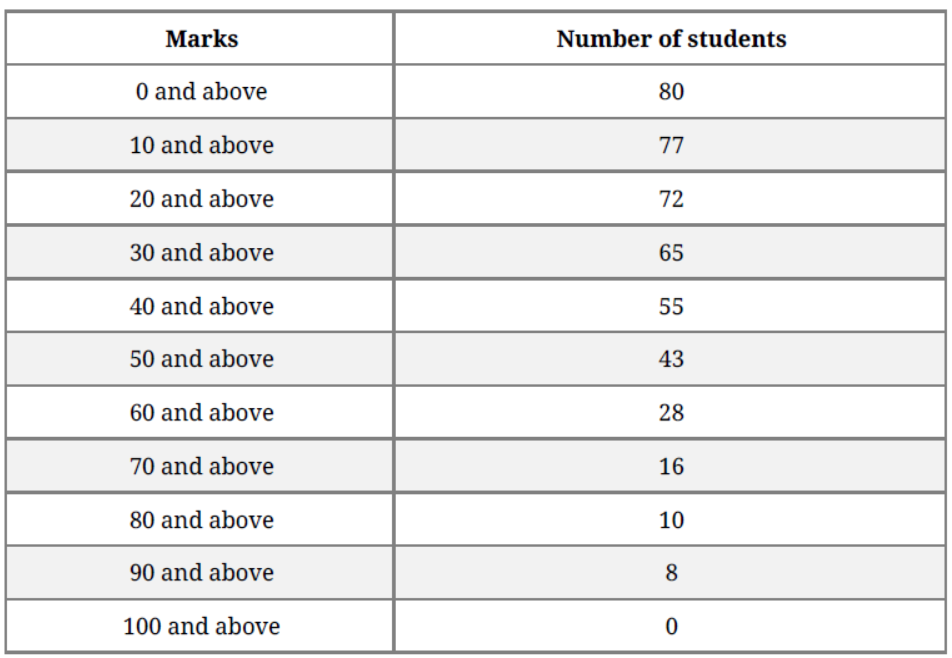
Question. The marks obtained by 100 students of a class in an examination are given below: 20 Draw cumulative frequency curves by using (i) ‘less than’ series and (ii) ‘more than’ series.
Hence, find the median.
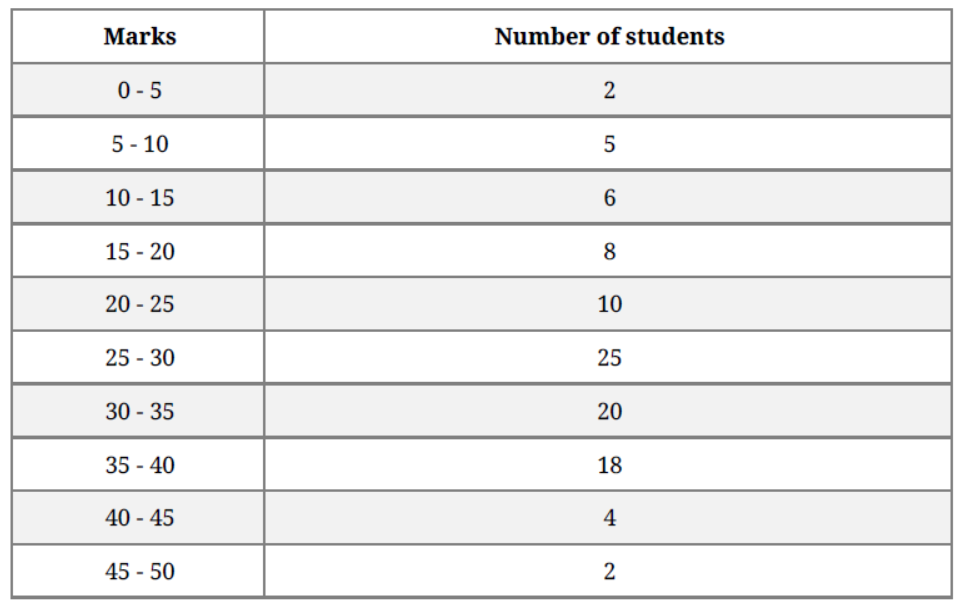
Solution.
i. Less than series:

Plot the points (5, 2), (10, 7), (15, 13), (20, 21), (25, 31), (30, 56), (35, 76), (40, 94), (45,
98) and (50, 100).
Join these points free hand to get the “less than” cumulative curve.
ii. ‘more than’ series:
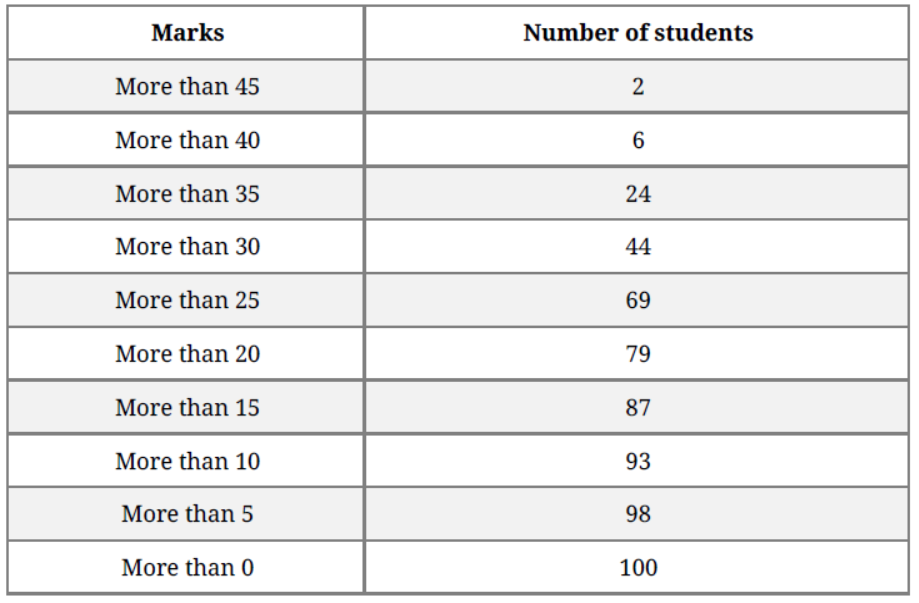
Now, on the same graph paper as above, we plot the point (0, 100), (5, 98), (10, 93),
(15, 87), (20, 79), (25, 69), (30, 44), (35, 24) , (40, 6) and (45, 2)

N = 100 ⇒ N/2 = 50
Two curves intersect at Point P(28, 50)
Hence, median = 28
Question. If the values of mean and median are 26.4 and 27.2, what will be the value of mode?
Solution. We know that
Mode = 3 median -2 mean
= 3(27.2) – 2(26.4)
= 81.6 – 52.8 = 28.8
Mode = 28.8
Question. What is the lower limit of the modal class of the following frequency distribution?
Solution. The Class having maximum frequency is called as modal class.
From observing table,
Here, maximum frequency = 27.
∴ The modal class is 40 – 50.
The lower limit of the modal class is 40.
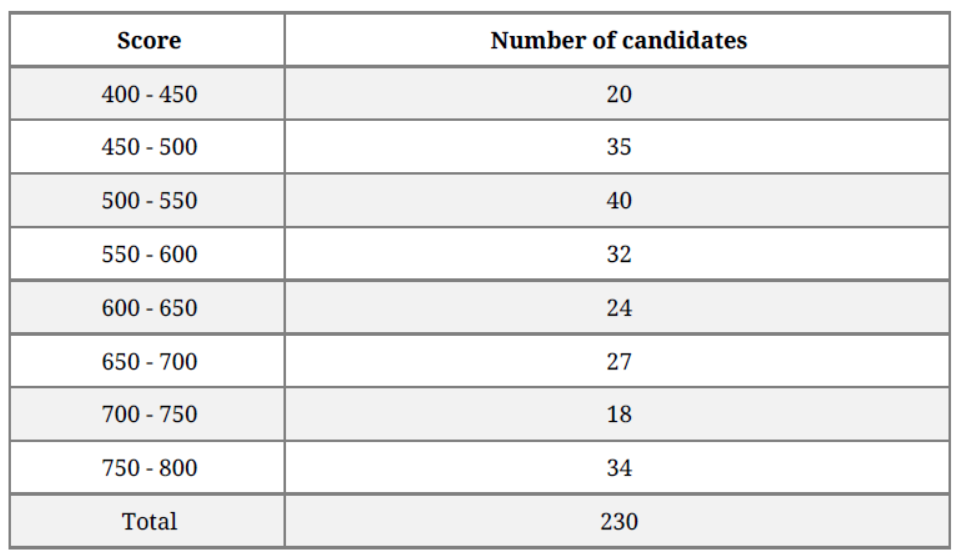
Question. Candidates of four schools appear in a mathematics test. The data were as follow:

If the average score of the candidates of all the four schools is 66, find the number of candidates that appeared from school III.
Solution. Let the number of candidates from school III = P
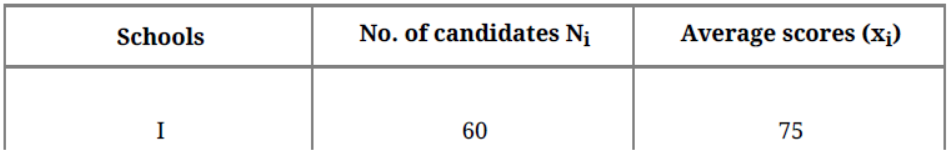
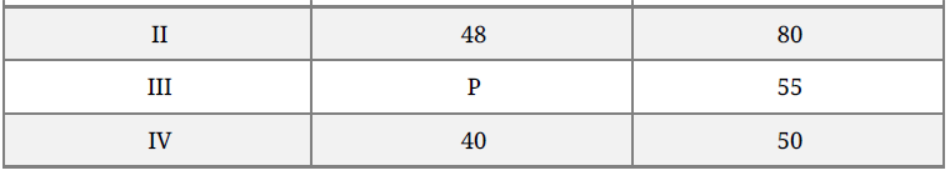
Given
Average score for all schools = 66
Question. Convert the following cumulative distribution to a frequency distribution:
Solution.

Question. The median of the following data is 525. Find the values of x and y if the total frequency is 100.
Solution.
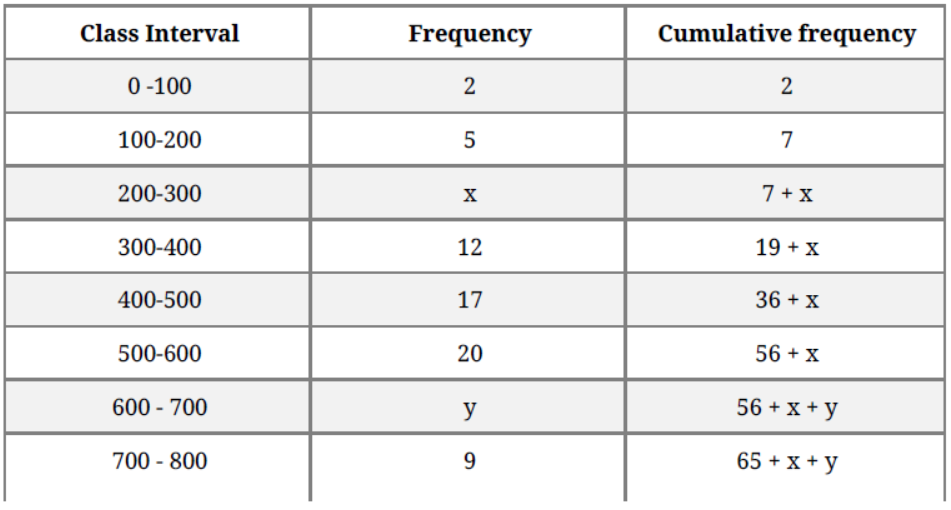
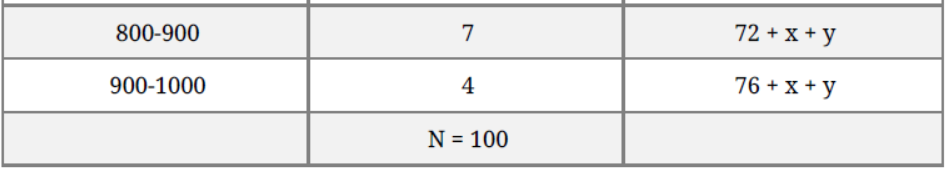
Hence, 6 + x + y = 100
⇒ x + y = 100 – 76 = 24
Given, Median = 525, which lies between class 500 – 600
⇒ Median class = 500 – 600
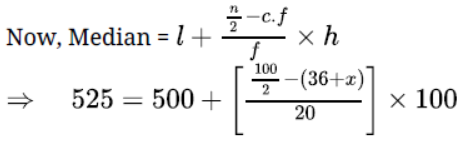
⇒ 25 = (50 – 36 – x)5
⇒ (14 – x) = 5
⇒ x = 14 – 5 = 9
Substituting the value of x in equation (i),
y = 24 – 9 = 15
Hence, x = 9 and y = 1
Question. A class teacher has the following absentee record of 40 students of a class for the whole term. Find the mean number of days a student was absent.
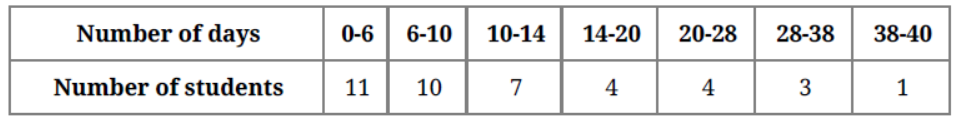
Solution.

Using the direct method,
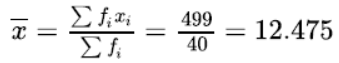
Hence, the mean number of days a student was absent is 12.48.
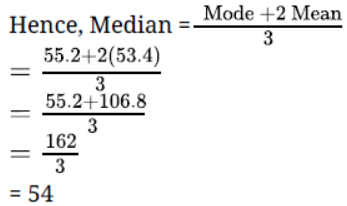
Question. If the mean and mode of a frequency distribution be 53.4 and 55.2 respectively, find the median.
Solution. Mean = 53.4
Mode = 55.2
Mode = 3 Median – 2 Mean
Question. Find the mode of the following data: 15, 8, 26, 25, 24, 15, 18, 20, 24, 15, 19, 15
Solution. Mode : It is the value which occurs maximum number of times.
Given data:
15, 8, 26, 25, 24, 15, 18, 20, 24, 15, 19, 15
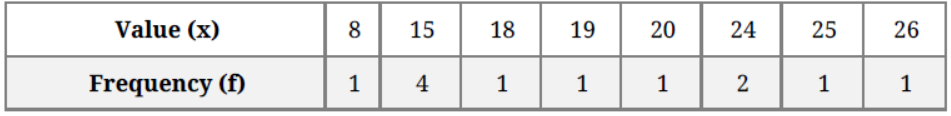
∴ From above table,
Mode = 15 because it occurs maximum number of times.
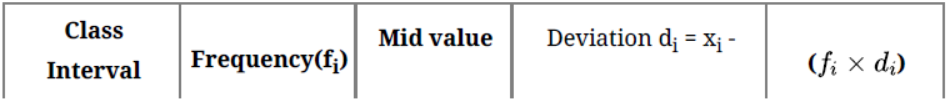
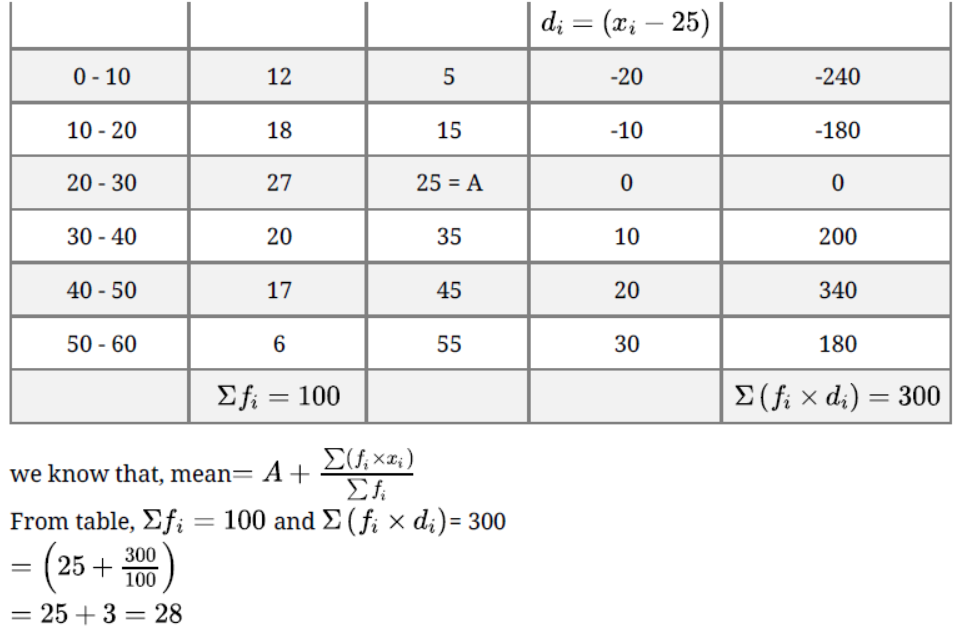
Question. During a medical check-up, the number of heartbeats per minute of 30 patients were recorded and summarised as follows:

Find the mean of heartbeats per minute for these patients, choosing a suitable method.
Solution. Following table shows the given data & assumed mean deviation method to calculate the mean :-

Let, assumed mean ( A ) = 75.5…..(1)
Now, from table :-
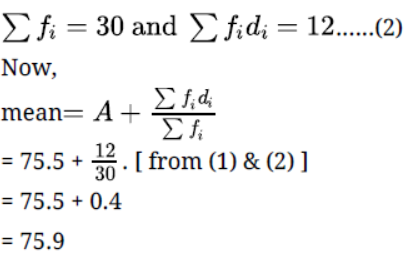
Thus, the mean of heartbeats per minute for these patients is 75.9
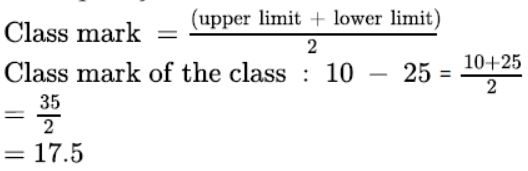
Question. Find the class marks of classes 10 – 25 and 35 – 55.
Solution. Class – mark of class 10 – 25 = 10 + 25 / 2 = 35/2 = 17.5
Class – mark of class 35 – 55 = 35 + 55/2 = 90/2 = 45
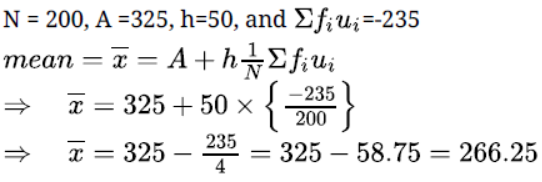
Question. The following table gives the distribution of total household expenditure (in rupees) of manual workers in a city. Find the average expenditure (in Rs.) per household.
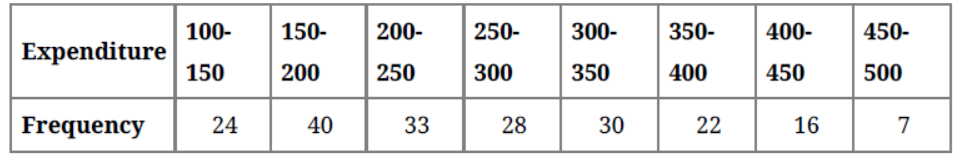
Solution.
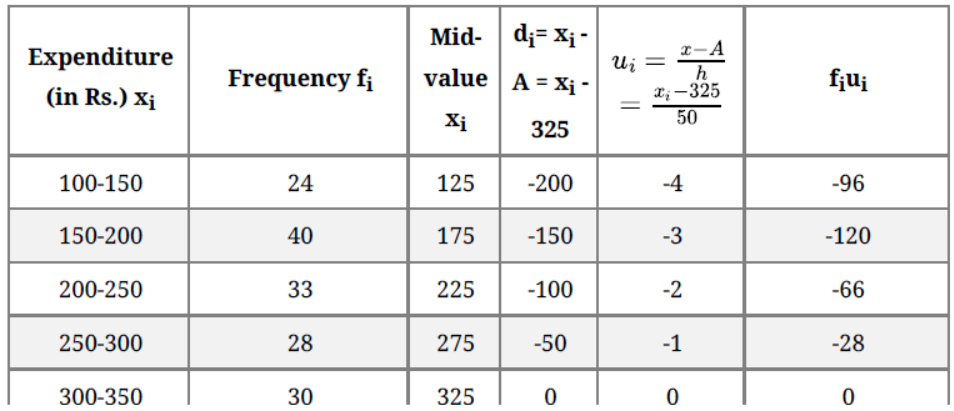
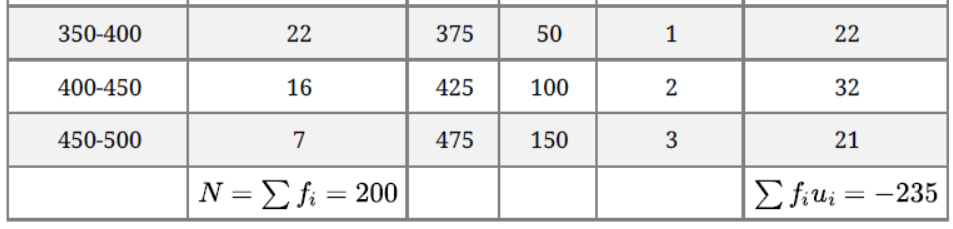
Let the assumed mean be A=325.
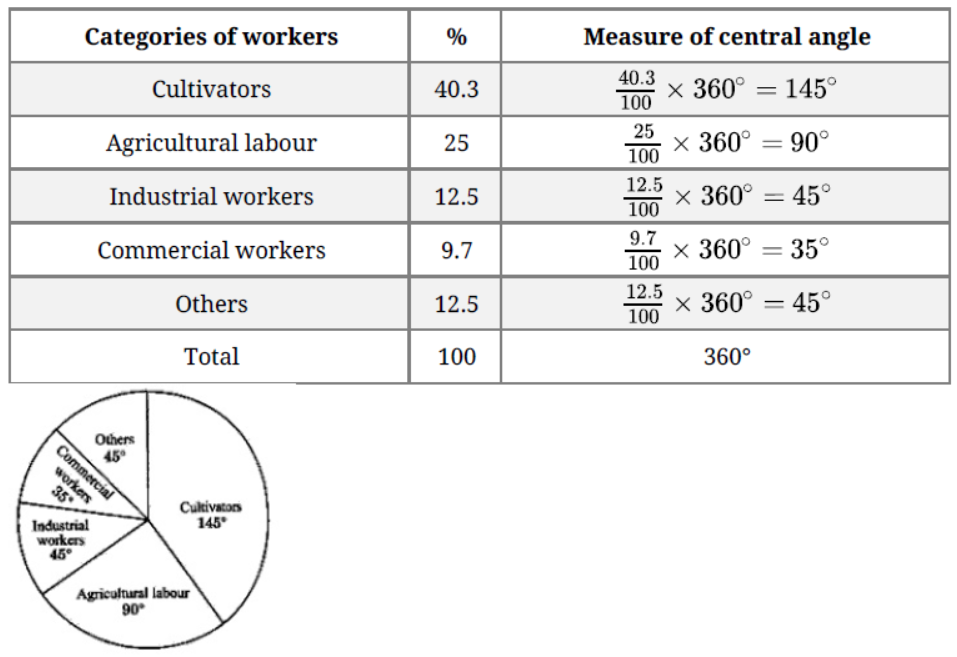
Question. The percentage of various categories of workers in a state is given in the following table. Present the information in the form of a pie chart .
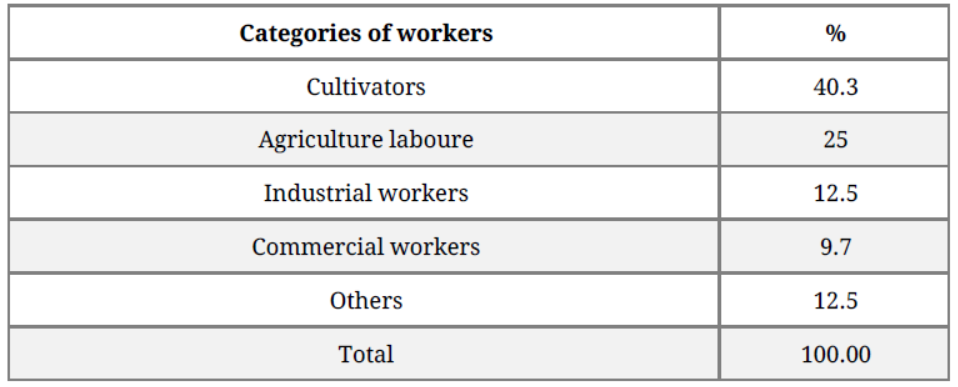
Solution.
Question. In the table given below, the times taken by 120 athletes to run a 100-m hurdle race are given.
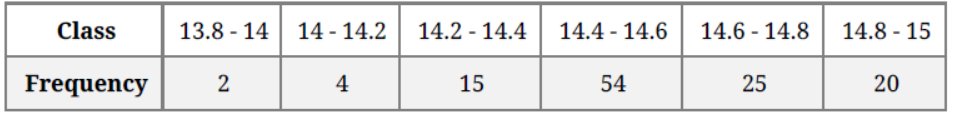
Find the number of athletes who completed the race in less than 14.6 seconds.
Solution. According to the question,
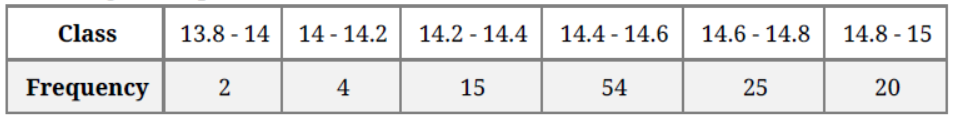
Number of athletes who completed the race in less than 14.6 seconds are
= 2 + 4 + 15 + 54 = 75
Therefore, 75 athletes completed the race in less than 14.6 seconds.
Question. Draw ‘more than’ ogive for the following distribution. Find the median from the curve:
Solution.
Graph:
From graph,
Median = N/2
N/2 = 100/2 = 50
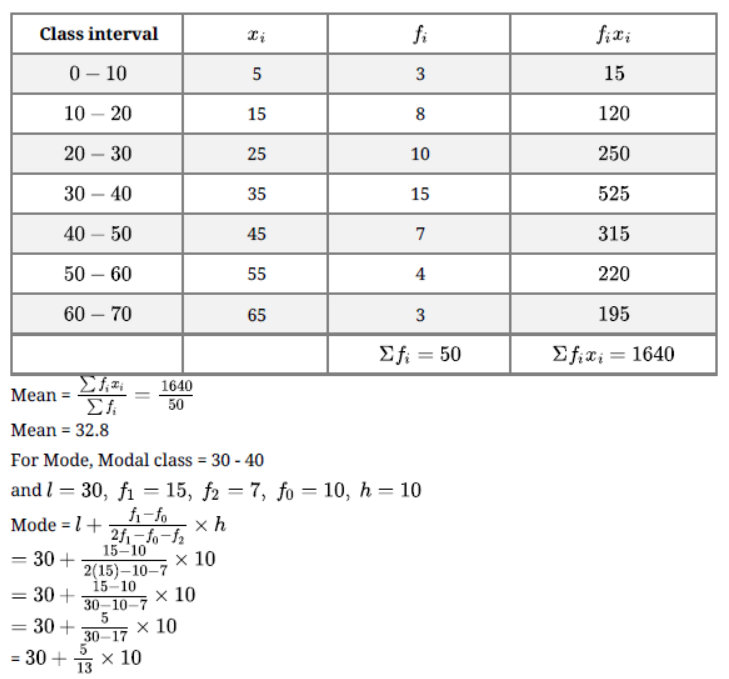
Question. Find the mode, median and mean for the following data:

Solution. Table:
Question.
Write the proper data (marks) and frequency (Number of students).
Solution. Table:
Question. Convert the following data to a less than type distribution.

Solution.

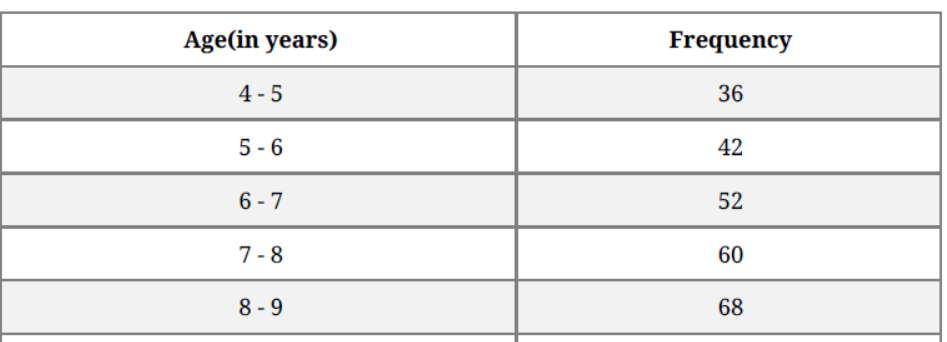
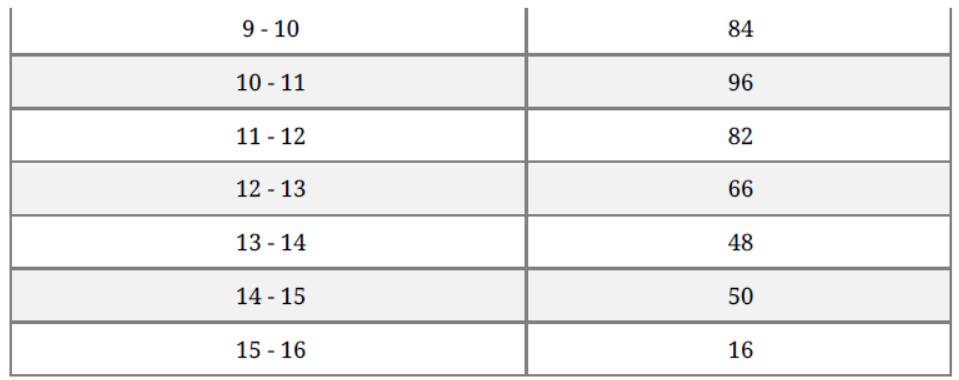
Question. Following is the age distribution of a group of students. Draw the cumulative frequency curve of ‘less than’ type and hence obtain the median value.
Solution. ‘less than’ type :
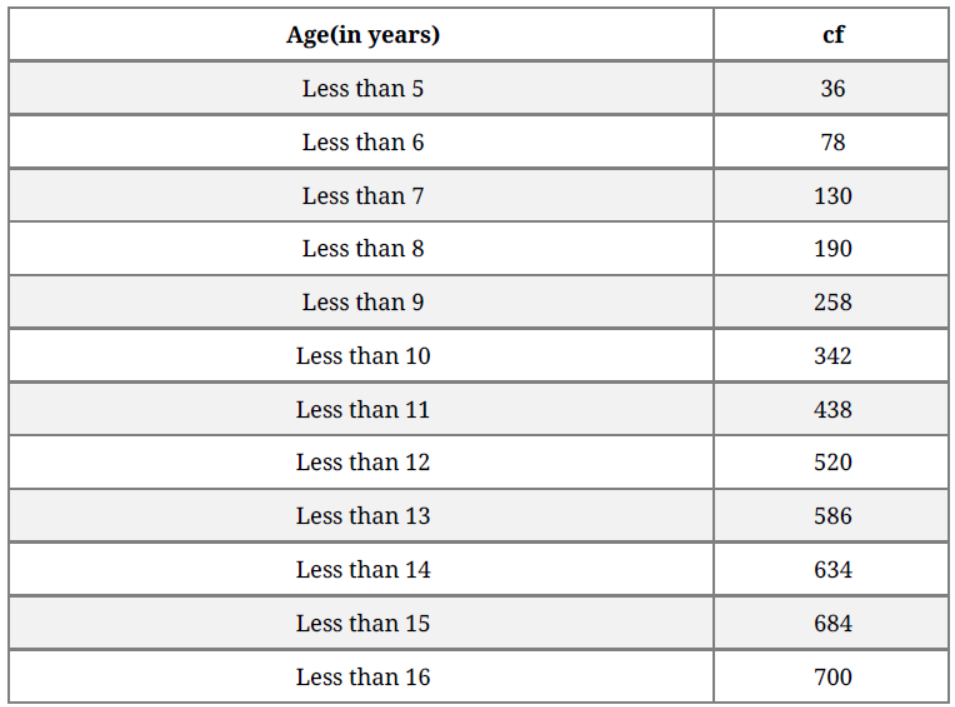
And, plot the points A(5, 36), B(6, 78), C(7, 130), D(8, 190), E(9,258), F(10,342), G(11, 438),
H(12,520), I(13,586), J(14,634), K(15,684) and L(16,700).
We join freehand these points to get the cumulative frequency curve.
On a graph paper, we take the scale.
Scale:
Along x – axis, 5 small divisions = 1
Along the y – axis, 1 small division = 10
Here, N = 700 ⇒ N/2 = 350
Take a point P(0, 350) on the y-axis and draw PQ || x-axis, meeting the curve at Q.
Draw QM x-axis, intersecting the x-axis at M whose coordinates are (10,0).
Hence, median = 10 years.
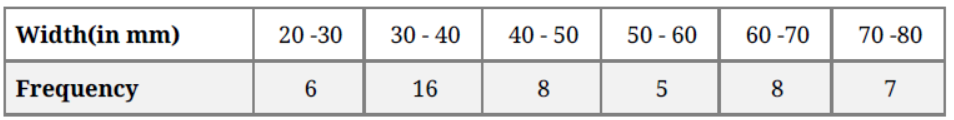
Question. The widths of 50 leaves of a plant were measured in mm and their cumulative frequency distribution is shown in the following table. Make frequency distribution table for this.
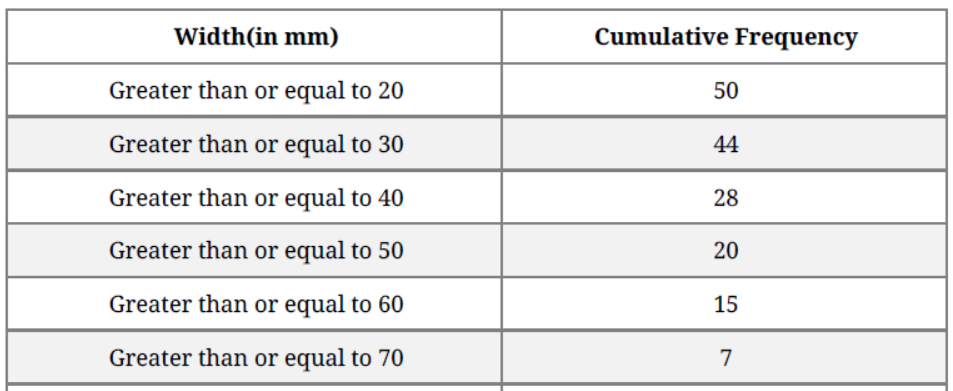

Solution. Table:
Question. The mean of ‘n’ observations is –x , if the first term is increased by 1, second by 2 and so on. What will be the new mean?
Solution. Mean of the series = −x
According to the question, terms of new series-
I term + 1
II term + 2
III term + 3
n terms + n

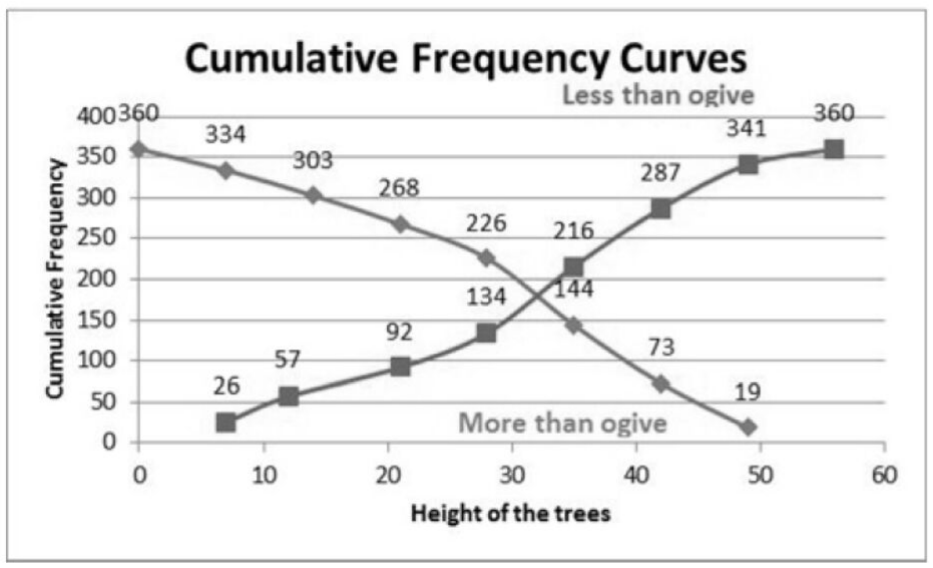
Question. The following table gives the height of trees:

Draw ‘less than’ ogive and ‘more than’ ogive.
Solution. By less than method:
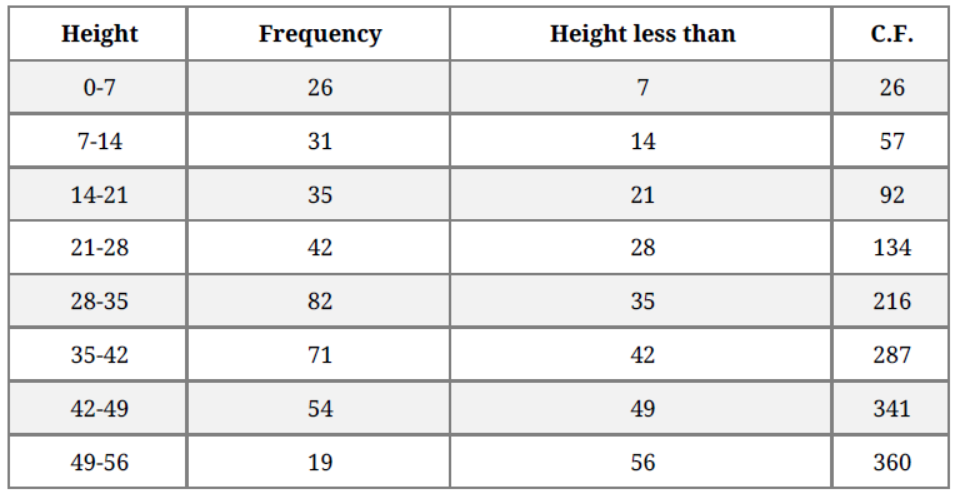
Plot the points (7,26) , (14,57) , (21,92) , (28,134) , (35,216) , (42,287) , (49,341) , (56,360)
by taking upper class limit over the x-axis and cumulative frequency over the y-axis.
By more than method:

plot (0,360) , (7,334) , (14,303) , (21,268) (28,226) , (35,144) , (42,73) , (49,19) by taking
lower class limit over the x-axis and cumulative frequency over the y-axis.
Question. Find the mean of the following frequency distribution :
Solution.
Question. If the mean of the following distribution is 27, find the value of p.
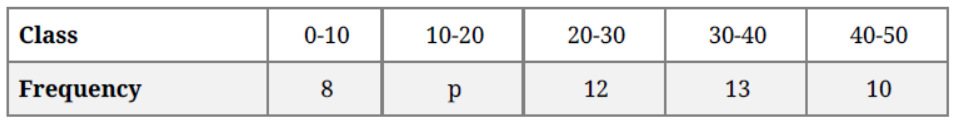
Solution.

Given mean =27

1245 + 15p = 1161 + 27p
12p = 84
P = 7
Question. If the mean of the following data is 14.7, find the values of p and q.
Solution.

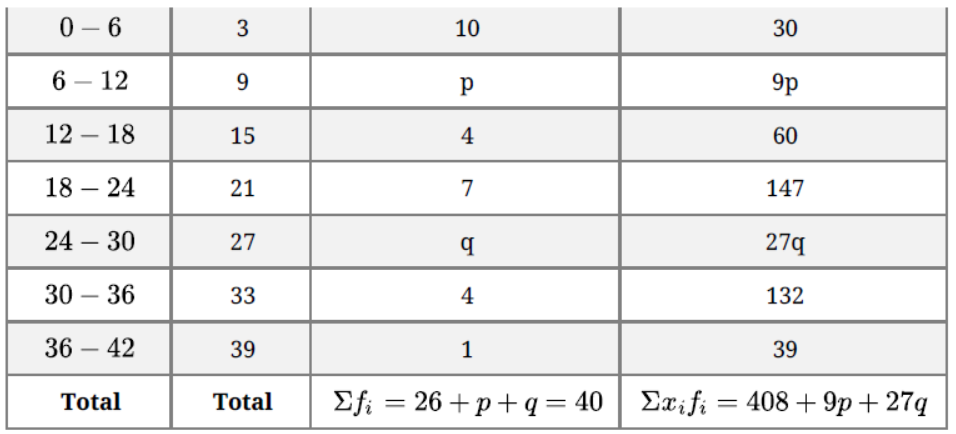

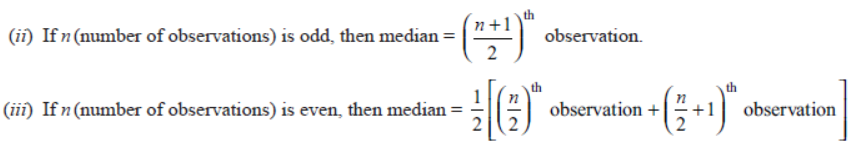
Question. A data has 25 observations arranged in a descending order. Which observation represents the median?
Solution. Number of observations = 25
= Value of 13th Observation
Question. Find the mean marks per student, using assumed-mean method:
Solution. the assumed mean is 25.
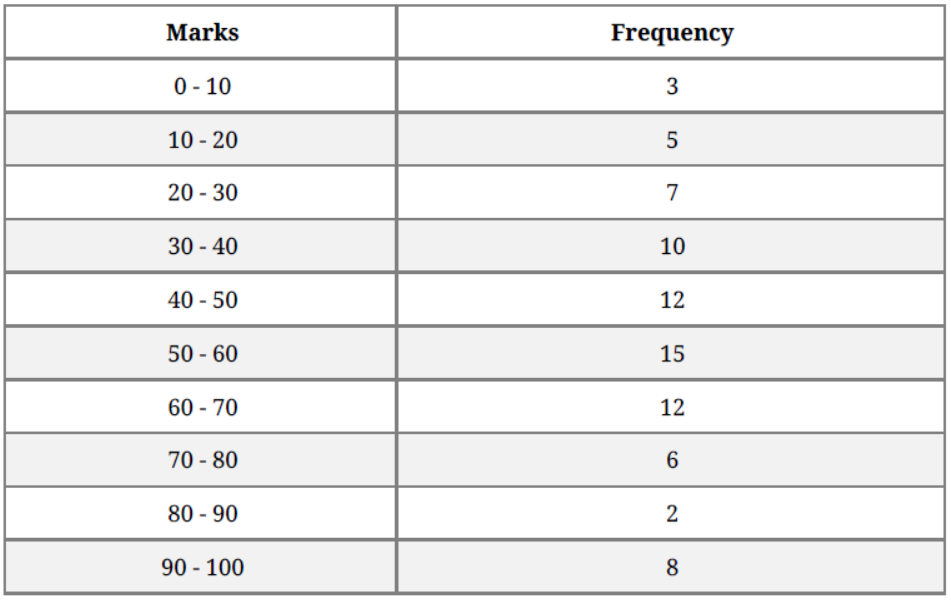
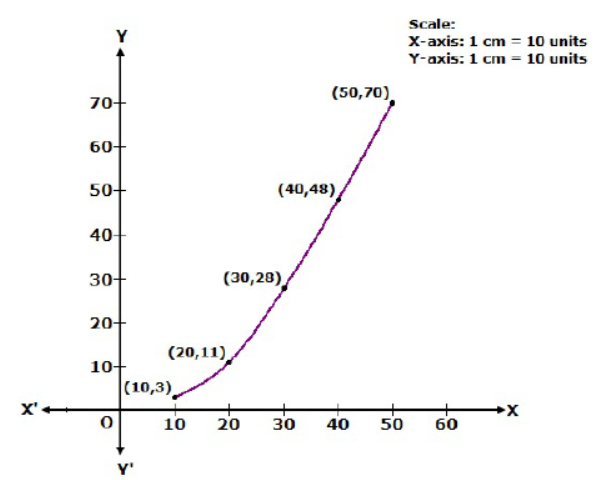
Question. Following is the distribution of marks of 70 students in a periodical test:
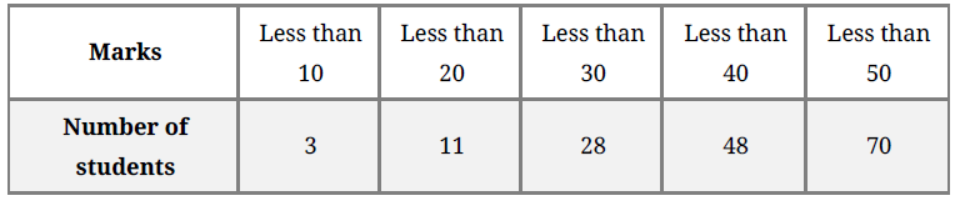
Draw a cumulative frequency curve for the above data.
Solution. We plot the points (10, 3), (20, 11), (30, 28), (40, 48) and (50, 70) to get the cumulative frequency curve as follows:
Question. In a health check-up , the number of heart beats of 40 women are recorded in the following table:
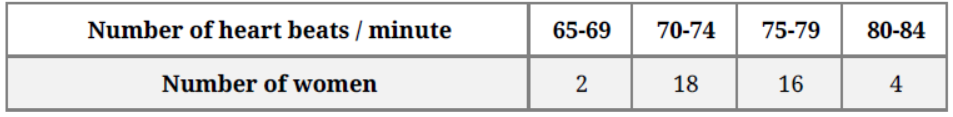
Find the mean of data.
Solution.

Here, class intervals are not continuous . But mid – value xi of each class interval
would be same either class interval is continuous or not continuous.
So , we solve it without making it continuous.
Also, xi’s are larger , so we apply step-deviation method.
Here, class width (h) = 5.
Table for the given data is:

Mean of given data is 74.75.
Question. For a particular year, the following is the distribution of the age (in yrs.) of primary school teachers in H.P:

Find how many teachers are of age less than 31 years.
Solution. Number of teachers of age less than 31 years = 11 + 32 + 51 = 94
Question. For the following distribution, calculate mean using all suitable methods:
Solution. By direct method
Let the assumed mean (A) = 6.5
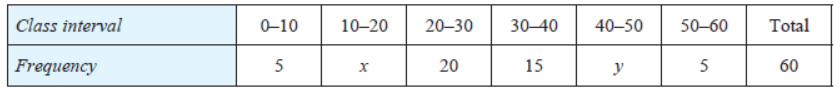
Question. Consider the following distribution :

i. Calculate the frequency of class 30 -40.
ii. Calculate the class mark of class 10 – 25
Solution. i.


ii.
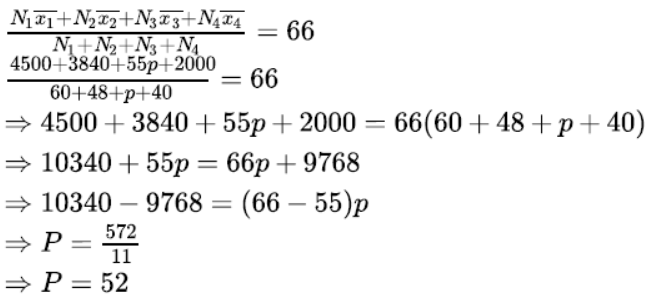
Question. The lengths of 40 leaves of a plant are measured correct to the nearest millimetre and the data obtained is represented in the following table :

Find the median length of the leaves.
Solution. Making class intervals continuous by subtracting 0.5 from each lower limit and adding 0.5 to the
upper class limit.
∴ Required cumulative frequency distribution table is :
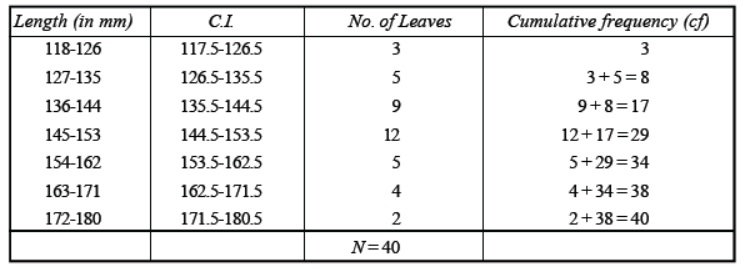
For median, N/2 = 20 , which lies in the class 144.5 – 153.5.
So, the median class is 144.5 – 153.5.
Now, lower limit (l) of the median class = 144.5
frequency (f) of the median class = 12
cumulative frequency (F) of the class preceding the median class = 17.
∴ Median = l + N/2 – F / f x h
= 144.5 + 20 – 17 /12 x 9
= 144.5 + 27 /12 = 144.5 2.25
= 146.75
∴ Median length of the leaves = 146.75 mm Ans.
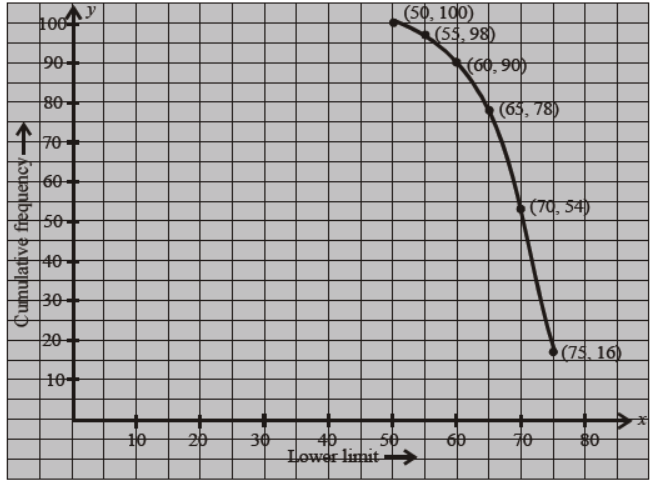
Question. The following table gives production yield per hectare of wheat of 100 farms of a village :
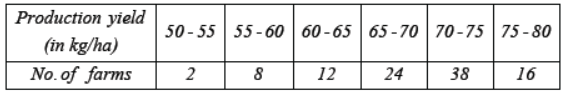
Change the distribution to a more than type distribution and draw its ogive.
Solution. More than type ogive
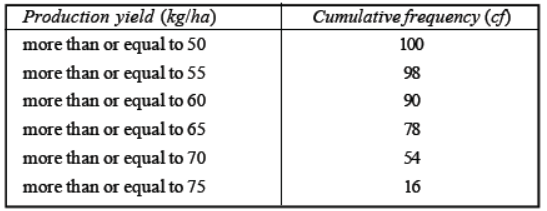
Now, draw the ogive by plotting the points (50, 100), (55, 98), (60, 90), (65, 78), (70, 54) and (75, 16).
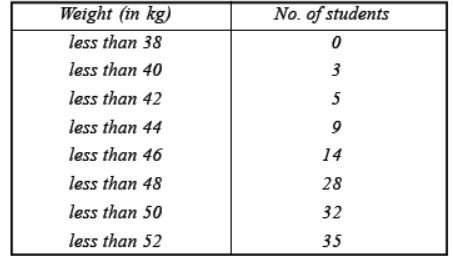
Question. During the medical check-up of 35 students of a class, their weights were recorded as follows :
Draw a less than type ogive for the given data. Hence obtain the median weight from the graph and verify the result by using the formula.
Solution. Draw the ogive by plotting the points (38, 0), (40, 3), (42, 5), (44, 9), (46, 14), (48, 28), (50, 32) and (52, 35) on the graph paper.
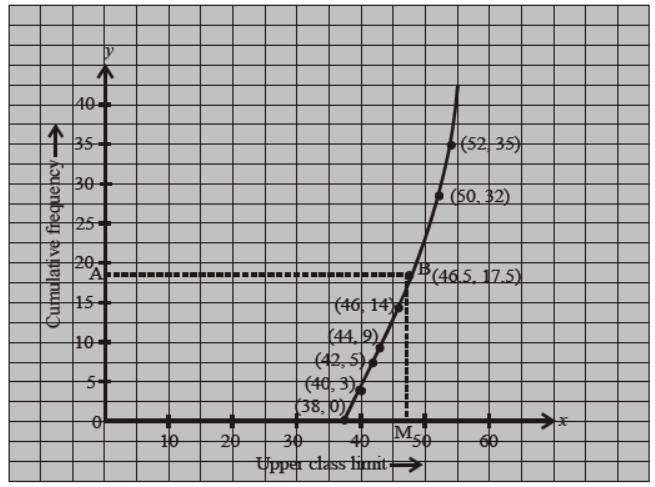
Here, N/2 = 35/2 = 17.5
Draw a line AB at a distance of 17.5 × 4 = 70 small squares on y-axis parallel to x-axis as shown in the graph, which meets the ogive curve at B. Draw BM ⊥ OX.
M indicates median of the above data, which is 46.5.
∴ median = 46.5 kg.
Verification :
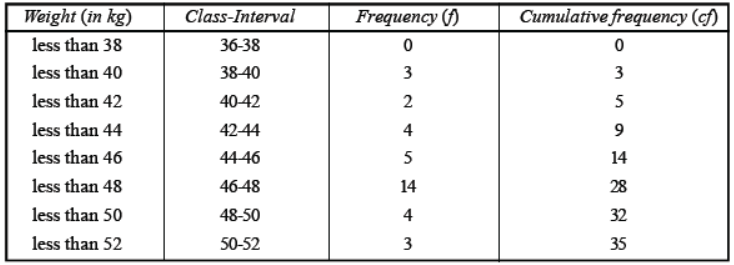
here, N/2 = 35/2 = 17.5 , which lies in the class 46-48.
So, the median class is 46-48.
Now, lower class interval (l) of median class = 46
width (h) of the median class = 2
frequency (f) of the median class = 14
cumulative frequency (F) of the class preceding the median class = 14
∴ Median = l + N/2 – F /f x h
= 46 + 17.5 – 14 / 14 x 2 = 46 .5 kg.
Hence verified.
Question. The following table shows marks secured by 140 students in an examination :

Calculate mean marks by using :
(i) direct method
(ii) assumed mean method (or short-cut method)
(iii) step-deviation method
Solution. Let the assumed mean (A) = 25, h = 10


Question. Find the mode of the following distribution table :

Solution. Here, the maximum frequency is 61, and the class corresponding to this frequency is 60-80. So, the
modal class is 60-80.
Now, lower limit (l) of modal class = 60
Class size (h) = 20
frequency (f1) of the modal class = 61
frequency (f0) of the class preceding the modal class = 52
frequency (f2) of the class following the modal class = 38.

Mathematics Statistics Worksheets for Class 10 as per CBSE NCERT pattern
Parents and students are welcome to download as many worksheets as they want as we have provided all free. As you can see we have covered all topics which are there in your Class 10 Mathematics Statistics book designed as per CBSE, NCERT and KVS syllabus and examination pattern. These test papers have been used in various schools and have helped students to practice and improve their grades in school and have also helped them to appear in other school level exams. You can take printout of these chapter wise test sheets having questions relating to each topic and practice them daily so that you can thoroughly understand each concept and get better marks. As Mathematics Statistics for Class 10 is a very scoring subject, if you download and do these questions and answers on daily basis, this will help you to become master in this subject.
Benefits of Free Class 10 Maths Statistics Worksheets
- You can improve understanding of your concepts if you solve NCERT Class 10 Mathematics Statistics Worksheet,
- These CBSE Class 10 Mathematics Statistics worksheets can help you to understand the pattern of questions expected in Mathematics Statistics exams.
- All worksheets for Mathematics Statistics Class 10 for NCERT have been organized in a manner to allow easy download in PDF format
- Parents will be easily able to understand the worksheets and give them to kids to solve
- Will help you to quickly revise all chapters of Class 10 Mathematics Statistics textbook
- CBSE Class 10 Mathematics Statistics Workbook will surely help to improve knowledge of this subject
These Printable practice worksheets are available for free download for Class 10 Mathematics Statistics. As the teachers have done extensive research for all topics and have then made these worksheets for you so that you can use them for your benefit and have also provided to you for each chapter in your ebook. The Chapter wise question bank and revision worksheets can be accessed free and anywhere. Go ahead and click on the links above to download free CBSE Class 10 Mathematics Statistics Worksheets PDF.

You can download free worksheets for Class 10 Mathematics Statistics from https://www.worksheetsbag.com
You can get free PDF downloadable worksheets for Grade 10 Mathematics Statistics from our website which has been developed by teachers after doing extensive research in each topic.
On our website we have provided worksheets for all subjects in Grade 10, all topic wise test sheets have been provided in a logical manner so that you can scroll through the topics and download the worksheet that you want.
You can easily get question banks, topic wise notes and questions and other useful study material from https://www.worksheetsbag.com without any charge
Yes all test papers for Mathematics Statistics Class 10 are available for free, no charge has been put so that the students can benefit from it. And offcourse all is available for download in PDF format and with a single click you can download all worksheets.
https://www.worksheetsbag.com is the best portal to download all worksheets for all classes without any charges.